

Intraday charts can produce dozens of price movements during a single session. Weekly charts compress those movements into one candle, making larger deviations easier to identify and giving each setup more time to develop.
That has helped popularize the idea that waiting for an extended weekly move to return towards an average can provide cleaner risk-reward than chasing short-term price movements.
There is some research behind weekly return reversal. But there is no credible evidence showing that weekly mean-reversion trades automatically offer 5x better risk-reward than intraday trades.
The useful question is therefore not whether weekly charts are automatically better. It is whether a clearly defined weekly mean-reversion rule can be measured, tested, and compared fairly with shorter-term trading.
So, instead of taking the 5x claim at face value, let’s break down how weekly mean reversion actually works, what the research says and where the comparison with intraday trading really stands.
What Is Mean Reversion in Trading?
Mean reversion is a trading approach based on prices moving back towards their average after moving unusually far above or below it.
For example, if a stock has been trading close to its average price for several weeks and then suddenly moves much higher or lower, a mean-reversion trader looks for signs that the price may start moving back towards that average.
What Does “Mean” Mean Here?
The mean is simply the average or reference level used to judge whether a move has become unusually large.
Depending on the strategy, traders may use:
- A moving average
- An average closing price over a fixed period
- VWAP or another average-price measure
- An average return over a chosen period
So, mean reversion is not based on one fixed average. The reference level depends on what the trader or researcher is trying to measure.
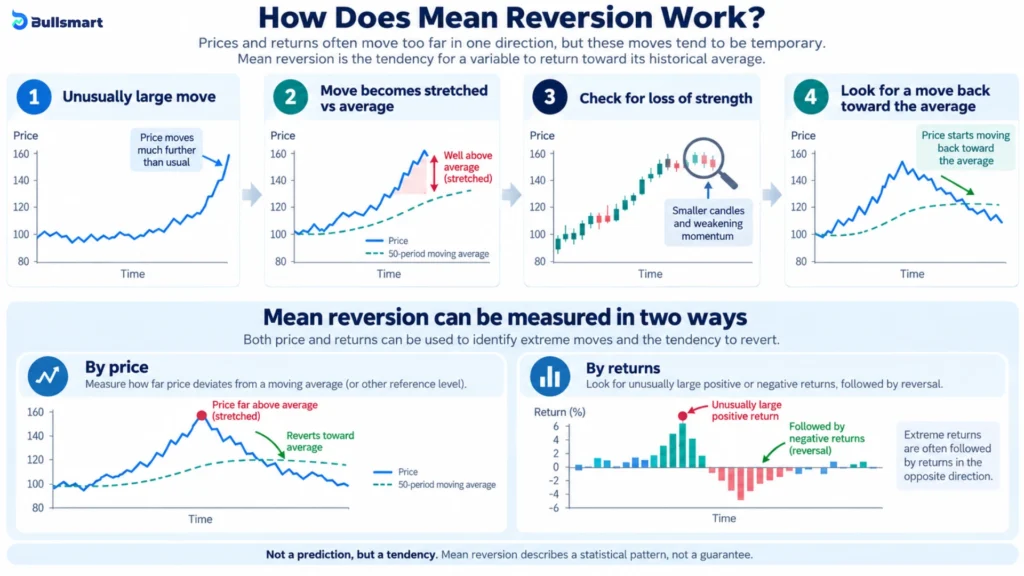
1. Price Mean Reversion
Price mean reversion looks at the distance between the current price and an average price level.
For example, a trader might compare Nifty with its 20-week moving average. If Nifty moves unusually far above or below that average, the trader may watch for signs that the gap is starting to narrow.
In simple terms, price mean reversion asks:
Has price moved unusually far from its average, and is it beginning to move back towards it?
This approach is commonly used in chart-based trading strategies.
2. Return Mean Reversion
Return mean reversion looks at something slightly different.
Instead of measuring how far price is from an average level, it studies whether an unusually large gain or loss is followed by a move in the opposite direction.
For example, researchers may examine whether a very large weekly decline is more likely to be followed by a positive weekly return.
So, return mean reversion asks:
After an unusually strong move in one direction, do returns tend to reverse in the following period?
This distinction becomes important when looking at academic research on weekly mean reversion because many studies examine return reversals, rather than whether price simply moves back towards a moving average.
Price Mean Reversion vs Return Mean Reversion
| Factor | Price Mean Reversion | Return Mean Reversion |
| What it measures | Distance between current price and an average price | Whether a large gain or loss is followed by a reversal |
| Reference used | Moving average, VWAP or another average price | Returns over different periods |
| Main question | Has price moved too far from its average? | Does an unusually large return reverse afterwards? |
| Common use | Chart-based trading setups | Statistical research and strategy testing |
| Simple example | Nifty moves far below its 20-week moving average | Nifty falls sharply in one week and gains in the next |
Does Mean Reversion Always Happen?
No. A price can move far away from its average and continue moving in the same direction. During a strong trend, that gap can remain wide for weeks or even longer.
Similarly, a large weekly loss does not automatically mean the following week will produce a positive return.
Mean reversion therefore describes a pattern that can be tested. It does not mean that every stretched price or extreme return will reverse.
That is why any mean-reversion strategy still needs clear rules for identifying an extreme move, entering a trade, exiting it and deciding when the setup is no longer valid.
Suggested Read: CRT on 1 Minute Charts: Scalping the Fake Breakout That Catches 90% of Retail Traders
What Does Research Say About Weekly Mean Reversion?
Research shows that weekly return reversals can occur, but the effect is usually short-term and conditional.
Short-Term Reversal Has Been Documented
Bruce Lehmann’s 1990 study found that US stocks showing strong gains or losses in one week often reversed part of that move in the following week.
A 2008 study by Roberto Gutierrez Jr. and Eric Kelley found a similar pattern. In the most extreme winner-versus-loser portfolio, the first-week reversal averaged about 69 basis points. However, the effect weakened quickly and had largely disappeared by around the third week.
Liquidity and Costs Matter
Avramov, Chordia and Goyal found stronger short-run reversals in high-turnover, low-liquidity stocks. But the estimated profits were smaller than likely transaction costs.
A 2025 Journal of Empirical Finance study also found stronger weekly reversal in smaller, less-liquid stocks with extreme daily returns and high retail order imbalance.
What Does This Mean?
The research does not show that prices automatically reverse every week.
Weekly mean reversion appears to depend on:
- How extreme the previous move was
- Liquidity
- Holding period
- Transaction costs
- Market conditions
So, weekly reversal is a documented effect, but not a universal trading rule.
Does a Weekly Timeframe Automatically Give Better Risk-Reward?
No. The planned reward-to-risk ratio comes from three things: the entry price, the invalidation or stop level, and the target.
If a setup risks Rs. 10 per share to pursue a possible Rs. 20 move, the planned reward-to-risk ratio is 2:1.
Changing from an intraday chart to a weekly chart does not automatically turn that into 5:1.
Weekly candles generally cover wider absolute price ranges. The potential target may therefore be farther away, but a sensible invalidation level may also need to be farther away.
Volatility, gaps, slippage and position sizing matter as well.
There is therefore no factual basis for saying that weekly mean reversion inherently provides five times the risk-reward of intraday trading.
The ratio has to be calculated from the actual setup.
Why Weekly Mean Reversion Looks Different From Intraday Trading
The biggest difference is speed and trading frequency.
A weekly setup develops over several days, while a 1-minute or 5-minute setup can change multiple times within a single session. If the rules are applied consistently, weekly trading will therefore usually involve fewer decisions and fewer trades.
Fewer Trades Can Mean Lower Cost Impact
Frequent trading creates more opportunities for brokerage, taxes, slippage and other costs to add up.
SEBI’s study of individual intraday traders in India’s equity cash segment found that:
- 7 out of 10 traders incurred losses in FY23
- Among traders making more than 500 trades during the year, 80% were loss-makers
However, this does not prove that weekly mean reversion performs better. SEBI studied intraday trading broadly, not a direct comparison between intraday strategies and weekly mean reversion.
Weekly Trading Has Different Risks
Holding a position for several days introduces risks that an intraday trader may avoid by closing before the market shuts.
These include:
- Overnight price gaps
- Weekend developments
- Earnings announcements
- News released while the market is closed
So, while weekly mean reversion involves fewer trading decisions, slower does not automatically mean safer or more profitable.
How Do You Define the Mean on a Weekly Chart?
Mean reversion becomes subjective unless the reference is defined before looking at the result.
Moving Average
A straightforward method is to calculate an average of recent weekly closing prices.
A trader or researcher could test a 10-week, 20-week or 40-week average. None is automatically the best.
A shorter average adjusts more quickly as price changes. A longer average moves more slowly.
The key is consistency. Changing the moving-average period because a particular setup failed creates hindsight bias.
Percentage Distance From the Mean
One simple measurement is:
Distance from Mean (%) = (Weekly Close – Moving Average) / Moving Average x 100
This measures how far the weekly close has moved from the chosen average in percentage terms.
Z-Score
A z-score also considers recent variability:
Z-score = (Current Price – Rolling Mean) / Rolling Standard Deviation
In simple terms, it asks how unusually far the current price is from its recent average relative to normal movement.
That matters because a 5% deviation may be extreme for one security but perfectly normal for another.
Suggested Read: 5 Steps to Map Potential Stop Hunts Before They Happen With Order Block + CRT
How to Identify a Potential Weekly Mean-Reversion Setup
Step 1: Fix the Reference
Choose the rolling average and lookback period before reviewing what happened afterwards. Use the same definition throughout the test.
Step 2: Measure the Deviation
Calculate how far the weekly close is from the chosen mean using percentage distance, a z-score or another predefined volatility-adjusted measure.
Step 3: Define What Counts as Extreme
A deviation only becomes testable when “extreme” has a fixed definition.
Different thresholds can be compared during research, but the threshold should not be changed simply because one historical setup failed.
Step 4: Look for Evidence of Reversion
Being far from the mean does not confirm that a reversal has begun.
A measurable confirmation rule could check whether the next weekly close moves closer to the mean, whether the deviation shrinks, or whether price returns inside a predefined volatility band.
Step 5: Do Not Treat the Mean as a Guaranteed Target
A return to the moving average can be recorded as one possible outcome.
The average does not pull price towards it. Price may reverse partially, move sideways or continue farther away.
Step 6: Define Invalidation
Specify the price behaviour that would show the original mean-reversion idea is no longer behaving as expected.
Step 7: Check the Broader Trend
A strong trend can keep price extended for several weeks. That is why a large weekly deviation should be read alongside the wider market structure rather than treated as a standalone signal.
Suggested Read: 4 Reasons Nifty Fake Breakouts Hit Your Stop-Loss and Reverse
Mean Reversion Is Not the Same as Buying Every Weekly Fall
A falling weekly price can represent very different situations.
- A temporary deviation occurs when price stretches from its historical reference and subsequently moves closer to it.
- A new trend develops when price keeps moving away while the rolling average itself begins moving in the same direction.
- A structural repricing happens when new information changes what market participants are willing to pay. Earnings, regulations, corporate actions or changes in business expectations can shift the price range considered reasonable.
This distinction matters because the moving average follows price. Price is not mechanically pulled towards the moving average. Being far below an average does not automatically make a security cheap, oversold or ready to reverse.
Why Weekly Mean-Reversion Setups Can Fail
Weekly mean-reversion setups can fail for several reasons:
- Strong trends can continue: A price that looks stretched may keep moving in the same direction. The Gutierrez and Kelley study found that short-term reversal was brief, while longer-term momentum eventually became stronger.
- The chosen mean matters: A stock may look far from its 10-week moving average but still be close to its 40-week average. Different reference periods can therefore give different signals.
- Volatility can change what counts as “extreme”: A move that looks unusually large during a quiet market may be completely normal when volatility rises.
- The stock may be repriced for a reason: Earnings, regulatory decisions or major corporate developments can permanently change how the market values a stock. In such cases, the old average may no longer be a useful reference.
- Trading costs still matter: Brokerage, taxes, slippage and other costs can reduce the returns from frequent entries and exits.
- Holding overnight adds risk: Weekly positions remain exposed to overnight gaps, weekend news and developments that occur while the market is closed.
Distance from the mean identifies a condition. It does not confirm that a reversal will happen.
Weekly Mean Reversion vs Intraday Trading
| Factor | Weekly mean-reversion framework | Intraday trading |
| Signal frequency | Usually lower | Usually higher |
| Price movement shown | More compressed | More short-term detail |
| Trading frequency | Often lower | Can be much higher |
| Overnight exposure | Yes | No if closed the same day |
| Absolute stop distance | Often wider | Often narrower |
| Decision time | Usually longer | Often shorter |
| Reversal guaranteed? | No | No |
| Inherently better risk-reward? | No | No |
The two approaches therefore create different trading conditions. The timeframe alone does not determine which will produce better results.
Suggested Read: 3 Powerful CPR Indicator Types for Nifty Intraday Trading: Narrow, Wide & Virgin CPR Explained
How to Backtest Weekly Mean Reversion Properly
A weekly mean-reversion backtest should use fixed rules and include every setup that qualifies.
1. Define the Rules
Specify:
- Instrument universe
- Weekly closing-price convention
- Mean or moving average used
- Lookback period
- Deviation threshold
- Entry and confirmation rules
- Stop-loss or invalidation
- Profit target
- Maximum holding period
- Transaction costs
- Treatment of dividends and corporate actions
2. Include Every Valid Setup
Test every signal that meets the rules. Do not select only the reversals that look obvious after the move has already happened.
3. Measure the Results Separately
- Hit rate: Percentage of trades that reached the defined target.
- Average reward-to-risk: Average reward earned compared with the risk taken per trade.
- Expectancy: Average profit or loss per trade after considering win rate, average win, average loss and trading costs.
A high hit rate does not necessarily mean the strategy is profitable. A high reward-to-risk ratio also does not help if the target is reached too rarely.
4. Check the Result Across Different Conditions
Test the same rules across different:
- Time periods
- Volatility conditions
- Stocks or indices
- Trending and range-bound markets
The main question is whether the strategy produces consistent positive expectancy after costs, not simply whether some weekly reversals worked.
Bottom Line
Weekly mean reversion has a genuine research history, particularly in studies of short-term return reversal. But that evidence does not mean every weekly extreme will reverse, every moving average acts as support, or weekly setups automatically provide five times the risk-reward of intraday trades.
The practical advantage of a weekly framework is slower observation and a more clearly defined testing horizon, not guaranteed profitability.
Mean reversion becomes useful only after the mean, deviation threshold, confirmation, invalidation, holding period and trading costs are defined in advance.
The real question is not whether weekly charts are better.
It is whether a clearly defined weekly reversal rule continues to work after every qualifying setup, failure and cost is included.
Disclaimer: This article is for educational and informational purposes only and should not be considered investment or trading advice. Mean-reversion strategies involve market risk and may not perform consistently across different securities, timeframes or market conditions. Historical research and backtested results do not guarantee future performance. Traders should evaluate their own risk tolerance, costs and strategy rules before making any trading decision.
FAQs
What is the best mean reversion strategy?
There is no single best mean reversion strategy. Common approaches use moving averages, Bollinger Bands, RSI or statistical deviation from an average. The effectiveness depends on the asset, timeframe, volatility, entry rules, risk management and trading costs. Any strategy should be backtested before use.
How do you calculate mean reversion?
First, choose an average such as a 20-period moving average. Then measure how far the current price has moved above or below it. Traders may use percentage deviation, standard deviation or indicators such as Bollinger Bands or z-scores to measure whether the move is unusually large.
What is the 3 time frame trading strategy?
The three-timeframe strategy analyses the same asset across three different timeframes. A higher timeframe identifies the broader trend, a middle timeframe helps locate the setup, and a lower timeframe helps refine the entry. The exact timeframes depend on the trader’s holding period and strategy.
Is weekly mean reversion really 5x better than intraday trading?
There is no credible evidence showing that weekly mean reversion automatically provides 5x better risk-reward than intraday trading. Weekly setups may involve fewer trades and less short-term noise, but they also carry overnight and weekend risks. The comparison depends on the exact strategy, costs, hit rate and expectancy.