

The tricky part with Demand and Supply Zones GTF is not spotting a zone on the chart. It is deciding exactly how that zone should be defined.
Should the wick be part of it? Should the body matter more? How many candles can form the base? How strong should the move away be? And when price comes back, at what point does a retest become an invalidation?
A trader can make these calls visually. An algorithm cannot. It needs every condition written down clearly.
That is where Algorithmic Zone Building becomes interesting.
Even a small change in the rules can change the zones an algorithm identifies. A wider boundary may keep a zone valid for longer. A tighter one may reject the same setup much earlier.
So the challenge is not just to mark demand and supply areas. It is to turn Demand and Supply Zones GTF into a repeatable framework that software can read, test and apply consistently across charts.
That is exactly what we are going to break down here.
What Are Demand and Supply Zones in Trading?
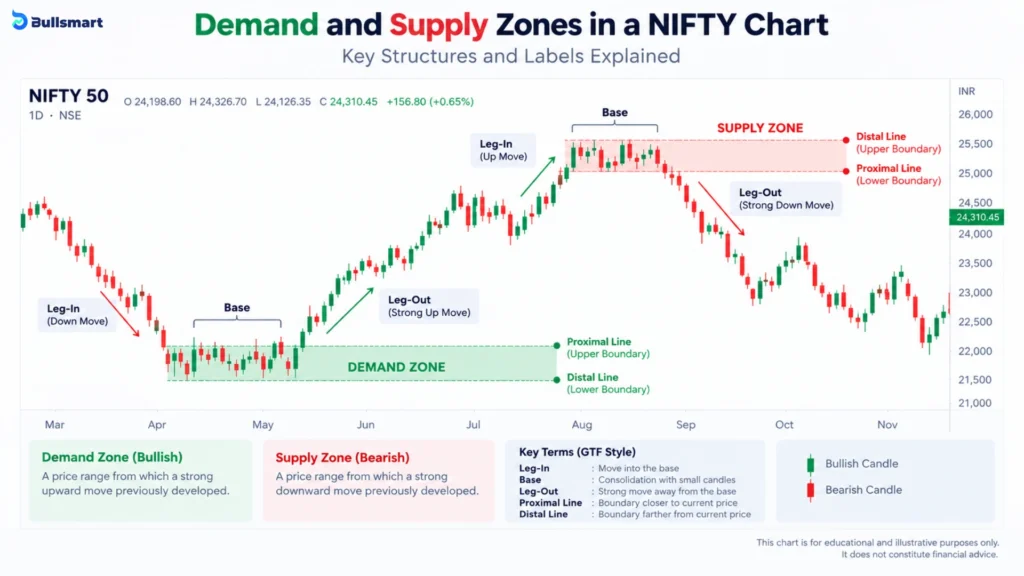
A demand zone is generally marked as a price area from which a strong upward move previously developed.
A supply zone is the opposite. It is an area from which a strong downward move previously developed.
They are usually drawn as ranges rather than single prices because the candles involved in the price reaction may cover several price levels.
This also separates the idea slightly from traditional support and resistance.
| Concept | What Is Marked | Common Basis |
| Support or resistance | Level or narrow area | Previous highs, lows or repeated reactions |
| Demand or supply zone | Wider price range | Base followed by strong departure |
| Algorithmic zone | Range created from fixed numerical rules | OHLCV data and coded conditions |
Research on support and resistance in foreign-exchange markets has found evidence that identified levels can contain information about where intraday trends may pause or reverse. However, the results varied across currencies and firms. That research does not establish that every demand or supply zone will produce a reaction.
Suggested Read: Mean Reversion on Weekly Timeframes: Is Risk-Reward 5x Better Than Intraday Chasing?
Build Your Own Demand Zone
The candles stay the same. You change the rules. See how base size, candle structure, departure strength and boundary method affect whether an algorithm accepts the setup.
How Are GTF-Style Demand and Supply Zones Built?
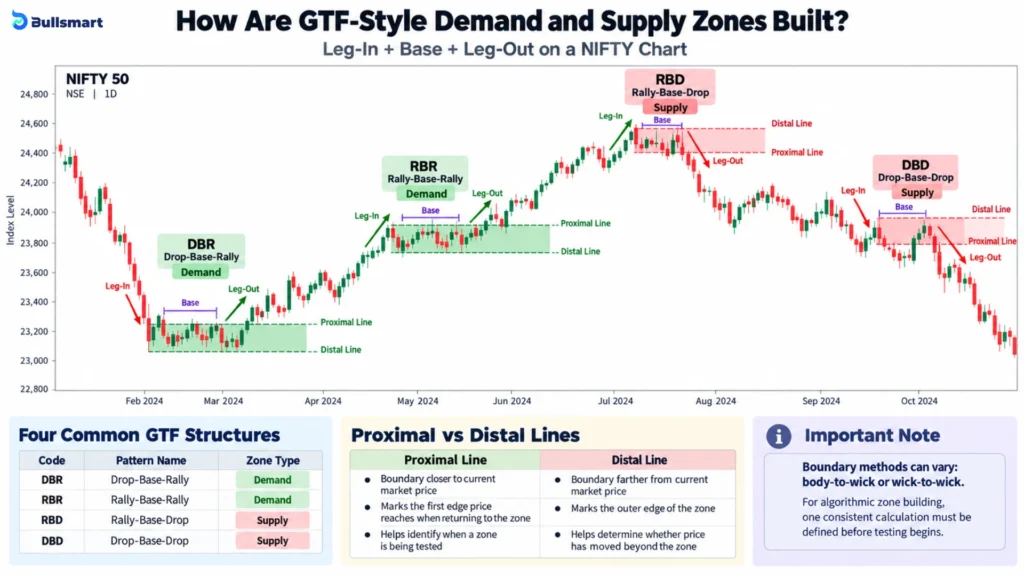
The GTF framework describes a zone using three basic components:
Leg-In + Base + Leg-Out
- The leg-in is the movement that brings price into the base.
- The base is the relatively compact group of candles where price movement pauses.
- The leg-out is the movement away from that base. GTF’s current material uses terms such as an “explosive” rise or fall when visually identifying this departure.
Four structures are commonly used within this framework:
| Structure | Classification |
| Drop-Base-Rally, or DBR | Demand |
| Rally-Base-Rally, or RBR | Demand |
| Rally-Base-Drop, or RBD | Supply |
| Drop-Base-Drop, or DBD | Supply |
GTF currently describes all four structures in its educational material.
Proximal and Distal Lines
Every demand or supply zone has two boundaries: a proximal line and a distal line.
| Feature | Proximal Line | Distal Line |
| Position | The boundary closer to the current market price | The boundary farther from the current market price |
| Role | Marks the first edge price reaches when returning to the zone | Marks the outer edge of the zone |
| What it defines | Where price begins entering the zone | How deep the zone extends |
| Why it matters | Helps identify when a zone is being tested | Helps determine whether price has moved beyond the zone |
GTF also allows different ways of drawing these boundaries, including body-to-wick and wick-to-wick marking.
For Algorithmic Zone Building, however, the key is consistency. The algorithm needs one clearly defined calculation for the proximal and distal lines before any testing begins. Otherwise, changing the boundary method can change the zones identified and the results produced.
Suggested Read: Why Algo Traders Dominate Indian Expiry Day: The Mechanics, the Data, and What Retail Traders Can Do Differently in 2026
Why Is Manual Demand and Supply Zone Marking Subjective?
Before comparing the two, it helps to define them clearly.
Manual demand and supply zone marking is the process of identifying and drawing demand and supply zones on a chart using a trader’s visual judgement and interpretation of price structure.
Algorithmic zone building is the process of converting those same zone-marking ideas into fixed, measurable rules that software can apply automatically across charts.
The difference becomes clearer here:
| Point | Manual Zone Marking | Algorithmic Zone Building |
| Definition | Zones are identified and drawn by a trader using visual judgement | Zones are identified and drawn by software using predefined rules |
| Base selection | The trader decides what looks like a valid base | The algorithm follows fixed conditions for candle count, range or size |
| Zone boundaries | The trader decides whether to use bodies, wicks or both | The boundary calculation is defined in advance |
| Departure strength | The move away is judged visually | The move must meet a measurable condition such as distance, candle size or volatility |
| Retest | The trader decides whether price has meaningfully revisited the zone | A fixed penetration or price condition defines a retest |
| Invalidation | The trader decides when the zone no longer looks valid | A predefined price rule invalidates the zone |
| Consistency | Different traders may mark the same chart differently | The same rules should produce the same result each time |
This is why words such as “small base,” “strong departure” and “clean zone” create a problem for automation. They describe what a trader may recognise visually, but they do not tell a computer exactly what to measure.
This issue is not limited to demand and supply analysis. Academic research on technical analysis has also examined the subjectivity of visual chart-pattern recognition and developed rule-based methods to identify patterns more systematically.
So, Algorithmic Zone Building does not automatically make a zone better. Its main purpose is to make the definition of that zone more consistent, repeatable and testable.
Suggested Read: Using ChatGPT for Trading: Smart Move or Risky Bet?
How Does an Algorithm Identify Demand and Supply Zones?
Here is where visual chart reading becomes a data problem.
Step 1: Read OHLCV Data
The algorithm starts with market data such as:
- Open
- High
- Low
- Close
- Volume
- Timestamp
These values give the program the raw material needed to analyse candle structure and price movement.
Step 2: Detect Base Candles
A human may describe a base candle as small or quiet. Software needs a calculation.
One possible measurement is the body-to-range ratio:
|Close – Open| / (High – Low)
A candle with a relatively small body compared with its entire high-low range could be classified as a potential base candle.
But there is an important catch.
There is no universally established percentage that makes a candle a valid demand-supply base.
A rule such as “body must be below 40% of the candle range” is therefore a parameter to test, not a proven market law.
Step 3: Group the Base
Once individual base candles have been detected, the algorithm can check whether neighbouring candles belong to the same structure.
Rules could include:
- maximum number of base candles
- minimum candle overlap
- maximum width of the complete base
Every parameter has to be fixed before evaluating its historical performance.
Step 4: Measure the Leg-Out
“Strong departure” now needs a number too.
The program could measure:
- candle body
- candle range
- percentage price movement
- movement relative to Average True Range
- break of a previous swing high or low
- volume relative to recent volume
ATR measures market volatility rather than direction, so normalising a departure by ATR can help compare a move with the security’s recent trading range.
Instead of asking whether a candle looks explosive, the program can ask:
How large was this movement relative to recent volatility?
Step 5: Calculate Zone Boundaries
The algorithm then applies its selected boundary rule.
A body-to-wick model can use a body-derived price for one boundary and the relevant wick extreme for the other.
A wick-to-wick model can instead use the candle extremes.
Neither method should be described as inherently more accurate without testing it.
Step 6: Store the Zone
Every detected zone can then become a structured record:
Type | Time | Proximal | Distal | Pattern | Timeframe | Status
Now the zone is no longer just a rectangle on a chart. It is data that can be compared with thousands of other zones.
What Makes a Zone Fresh, Tested or Invalidated?
Once a demand or supply zone has been identified, an algorithm can continue tracking what happens to it.
Instead of treating every zone as permanently valid, the model can assign it a status based on how price interacts with it.
| Zone Status | Definition | What the Algorithm Checks |
| Fresh Zone | A zone that price has not revisited after its formation | Whether price has entered the predefined zone range since the zone was created |
| Tested Zone | A zone that price has returned to at least once | Whether a later candle has entered or touched the defined zone |
| Invalidated Zone | A zone that no longer satisfies the model’s validity rules | Whether price has crossed the distal boundary according to the chosen closing or intrabar rule |
Fresh Zone
A zone may be classified as fresh when price has not returned to its defined range after formation.
The algorithm therefore needs to record when the zone was created and continuously check later candles for any interaction with it.
Tested Zone
Once price returns to the zone, its status can change from fresh to tested.
The exact definition must still be specified. For example, the model may count:
- any touch of the proximal line
- any movement inside the zone
- a minimum percentage of penetration into the zone
GTF’s automatic indicator also provides previous-zone detection and the option to display tested zones, showing how these different zone states can be represented programmatically.
Invalidated Zone
A zone becomes invalidated when price meets the rule chosen to cancel it.
One model may invalidate a demand zone as soon as price trades below its distal line. Another may wait for a candle to close below it. The same logic can be reversed for a supply zone.
This means an algorithm must define not only the invalidation price, but also how price must cross it.
What Does a Fresh Zone Mean?
In demand and supply analysis, a fresh zone generally refers to a zone that price has not revisited since it was formed.
That definition is useful for chart analysis, but it should not be confused with proof that unfilled institutional orders are still sitting at that price.
An OHLC candle only shows the price activity completed during a given period. It does not reveal how many pending orders remain at a historical level. Actual unmatched orders exist in the exchange order book and are processed according to the exchange’s matching rules.
GTF’s own educational material also notes that the number of pending orders inside a zone cannot be directly counted.
So, for Algorithmic Zone Building, “fresh” is best treated as a chart-based classification:
A fresh zone is a zone that price has not returned to after its formation.
It describes the zone’s interaction history on the chart, not the presence of confirmed unfilled institutional orders.
Can Machine Learning Detect Demand and Supply Zones?
Rule-based detection is not the only way to automate chart levels.
Researchers have also tested machine-learning methods for identifying technical price areas.
A peer-reviewed study used actual EUR/USD tick data and experimented with methods based on a variant of K-means clustering and a Gaussian mixture model to establish support and resistance levels.
Another major study used non-parametric kernel regression to automate technical-pattern recognition across decades of US stock data.
These papers do not validate GTF demand and supply zones specifically.
What they demonstrate is something broader and useful: chart structures that traders normally identify visually can be treated as quantitative detection problems.
Manual Demand Supply Zones vs Algorithmic Zones
| Manual Zone Marking | Algorithmic Zone Building |
| Depends on visual judgement | Uses predefined rules |
| Boundaries may differ between analysts | Same rules produce repeatable boundaries |
| Context can be interpreted manually | Context must be coded |
| Practical for individual charts | Can scan large datasets |
| Difficult to test objectively | Easier to backtest |
| Flexible | Can become over-optimised |
Automation removes some visual subjectivity, but it introduces a different problem: parameter selection.
Someone still has to decide how large the base can be, which boundary method to use and how strong the leg-out must be.
How Do You Backtest an Algorithmic Demand and Supply Zone?
Building the detector is only half the job.
The next question is whether the rules behave consistently on data the developer did not use to design them.
Avoid Look-Ahead Bias
A zone must only use information that would have been available at the moment it was detected.
Using future candles to decide whether an earlier zone was valid creates look-ahead bias.
Avoid Overfitting
Changing the body ratio, ATR multiplier, zone width and retest rules repeatedly until historical results look impressive can produce a model tailored to the past.
Research on technical trading rules has repeatedly highlighted the risk of data snooping when large numbers of rules are tested and only successful ones are retained.
Record Every Zone, Not Just the Successful Ones
A serious test could record:
- instrument and timeframe
- formation time
- DBR, RBR, RBD or DBD classification
- base-candle count
- zone width
- leg-out magnitude
- leg-out relative to ATR
- relative volume
- proximal and distal prices
- first retest
- number of retests
- subsequent price movement
- invalidation time
If the zone rules later become part of a trading strategy, execution assumptions and transaction costs also need to be included.
Professional backtesting guidance specifically warns about problems including look-ahead bias and survivorship bias.
The purpose is not to prove that every zone works. It is to find out whether a fixed definition produces repeatable behaviour.
Can Demand and Supply Zones Predict Price Reversals?
Not by themselves.
A demand or supply zone can help identify an area where price previously showed a strong reaction. But detecting that zone is not the same as predicting what price will do when it returns.
Detection vs Prediction
| Task | What It Means |
| Zone detection | The candles meet the predefined rules for forming a demand or supply zone |
| Price prediction | Price is expected to reverse or react in a particular way when it reaches that zone |
Research on support and resistance in foreign-exchange markets has found evidence that technical levels can help identify areas where intraday trends may pause or change. However, the strength of that relationship varied across currencies and across firms producing those levels.
Research on technical trading rules also shows why historical performance needs to be tested carefully. Transaction costs, data snooping and out-of-sample testing can all affect whether a pattern that worked in past data continues to show a usable edge.
So, in Algorithmic Zone Building, a detected demand or supply zone should be treated as structured information about past price behaviour, not as a guaranteed reversal signal.
Algorithmic Zone Detection vs Algorithmic Trading in India
There is another distinction worth making.
Software that reads historical market data and automatically draws zones is performing analytical automation.
Software that uses predefined parameters to automatically generate and push buy or sell orders into the exchange trading system enters the area of algorithmic trading. NSE uses this type of automatic order generation in its definition of automated trading.
SEBI issued its retail algorithmic-trading framework on February 4, 2025. Following an extension of the implementation schedule, that framework became applicable across stock brokers from April 1, 2026. NSE also maintains a separate process for Client Direct API and retail-algo registration.
So detecting a zone and automatically trading it are not the same thing.
Bottom Line
Demand and supply zones become far more interesting once you stop treating them as rectangles drawn by eye and start asking what actually makes a zone valid.
That is the real point of Algorithmic Zone Building.
With Demand and Supply Zones GTF, ideas such as the base, leg-out, proximal and distal lines, freshness, retests and invalidation can all be translated into measurable rules. Once that happens, the same logic can be applied across hundreds or even thousands of charts without changing the definition halfway through.
But automation does not remove every problem. It simply replaces visual judgement with another challenge: choosing sensible parameters and testing whether they hold up outside the data used to create them.
And that is where traders need to stay realistic.
A zone being detected perfectly does not mean price must reverse there. The algorithm can tell you that the setup matches your rules. Only proper backtesting, out-of-sample testing and live-market observation can tell you whether those rules offer anything useful.
So the goal is not a “perfect zone.” It is a zone definition you can explain, repeat and actually test.
Disclaimer: This article is for educational and informational purposes only. Demand and supply zones, technical indicators and algorithmic detection methods do not guarantee future price movements or trading outcomes. Historical behaviour and backtest results may not repeat in live markets. Readers should refer to the latest SEBI and exchange rules before using automated trading systems.
FAQs
What are supply and demand zones?
Demand and supply zones are price areas where the market previously showed a strong move. A demand zone is associated with a strong upward move, while a supply zone is associated with a strong downward move. They are usually marked as ranges rather than single price levels and do not guarantee that price will react again.
What is a GTF indicator?
In this context, a GTF indicator refers to a tool based on GTF’s demand and supply zone framework. It can help identify zone structures automatically using predefined rules, including concepts such as bases, proximal and distal boundaries, previous zones and tested zones. The exact settings determine how those zones are identified and displayed.
Is algorithmic trading illegal?
No. Algorithmic trading is legal in India, but it is regulated. SEBI and stock exchanges prescribe requirements for brokers, APIs, algo providers and automated order generation. The retail algorithmic-trading framework introduced by SEBI is applicable across stock brokers from April 1, 2026. Traders and developers must follow the applicable broker and exchange requirements.
How does algorithmic trading work?
Algorithmic trading uses software to monitor predefined market conditions and automatically generate buy or sell orders when those conditions are met. The rules may use factors such as price, volume, time or technical indicators. Once the specified parameters are satisfied, orders can be generated and sent through the broker’s system to the exchange for execution.