

Fibonacci Time Zones are often explained as a way to predict when the next important market move or reversal could happen.
The idea sounds simple. Pick an important high or low, apply the Fibonacci sequence across the time axis, and watch the vertical lines at intervals such as 13, 21, 34, 55 and 89.
If price changes direction near one of those lines, the timing can look surprisingly accurate.
But there is a catch.
A Fibonacci Time Zone does not contain information about price. It cannot tell you whether Nifty will rise or fall, how large the move could be, or whether anything important must happen when the line appears.
There is another problem too. The location of every future zone depends on where you start measuring. Change the starting point or the chart timeframe, and the timing map changes with it.
Fidelity describes Fibonacci Time Zones as vertical lines placed at Fibonacci intervals from a chosen bar, while TradingView states that the tool is concerned with potential areas of importance in time, with no regard given to price.
So, instead of asking, “Can Fibonacci predict the exact time of the next reversal?”, a better question is:
Can Fibonacci Time Zones provide useful time references that hold up when we test them consistently?
Let’s dive in.
What Are Fibonacci Time Zones?
Fibonacci Time Zones are vertical lines placed along the time axis of a chart at increasing Fibonacci-number intervals.
Common intervals include: 1, 2, 3, 5, 8, 13, 21, 34, 55, 89 and 144
A major high or low is often used as the starting point, according to Fidelity. The chart then projects vertical lines forward as the Fibonacci intervals increase.
This is different from the Fibonacci tools covered in our earlier guide on Fibonacci Retracement and Extension.
| Tool | What It Tries to Measure |
| Fibonacci Retracement | How far price has pulled back |
| Fibonacci Extension | Where price could potentially extend |
| Fibonacci Time Zone | When a Fibonacci-based time interval occurs |
Retracement and extension work mainly with price levels.
Time Zones work with elapsed chart time.
That distinction drives almost everything else about the tool.
How Do Fibonacci Time Zones Work?
Fibonacci Time Zones mark Fibonacci-based time intervals on a price chart.
To understand the calculation, assume a trader selects Bar 100 as the starting point. The tool then counts forward from that bar using Fibonacci numbers: 8, 13, 21, 34, 55, and 89.
| Fibonacci Interval | Starting Bar | Projected Bar |
| 8 | 100 | 108 |
| 13 | 100 | 113 |
| 21 | 100 | 121 |
| 34 | 100 | 134 |
| 55 | 100 | 155 |
| 89 | 100 | 189 |
For example, the 34 interval means that the tool counts 34 chart periods forward from Bar 100, placing the vertical line at Bar 134.
Fidelity describes the calculation in the same basic way: vertical lines are drawn at Fibonacci intervals beginning from the selected bar.
The important thing to notice is that price is not part of this calculation.
When the 34-period line appears at Bar 134, the calculation does not tell us whether Nifty will be at 24,000, 25,000, 26,000, or any other price.
The calculation only tells us that:
34 chart periods have passed since the selected reference point.
In other words, Fibonacci Time Zones provide a time-based reference, not a mathematical calculation of a future price.
What Does Time Mean in Fibonacci Time Zones?
The word time can make the tool sound as though it is calculating exact dates.
Usually, it is better understood as counting chart bars.
Suppose we are tracking a 21-period Fibonacci interval.
| Chart Timeframe | 21 Bars Represent |
| Daily | Approximately 21 trading sessions |
| 15-minute | 315 chart minutes |
| 5-minute | 105 chart minutes |
The important phrase here is chart bars.
Markets are not open continuously. Weekends, exchange holidays, and overnight closures interrupt calendar time.
For example, 21 daily bars do not mean 21 calendar days because Saturdays, Sundays, and market holidays are not included as regular trading bars.
So, a 34-period Fibonacci Time Zone means 34 bars after the anchor, not necessarily 34 calendar days.
Suggested Read: 2 Powerful Fibonacci Levels Explained: Fibonacci Retracement vs Fibonacci Extension
Where Should You Start a Fibonacci Time Zone?
Choosing the starting point is one of the most important parts of using Fibonacci Time Zones.
The Fibonacci numbers remain the same, but the lines on the chart change depending on where you start measuring.
According to Fidelity, traders often use a major market high or low as the starting point.
Some common starting points include:
- A major swing high
- A major swing low
- The beginning of a strong upward or downward move
- A breakout point
- Another important turning point on the chart
Let’s Understand With an Example
Imagine two traders analysing the same Nifty chart.
Trader A chooses candle 100 as the starting point.
Their 34-period Fibonacci Time Zone appears at: 100 + 34 = Candle 134
Trader B chooses candle 105 because they consider it a more important turning point.
Their 34-period Fibonacci Time Zone appears at: 105 + 34 = Candle 139
Both traders use the same Fibonacci number (34), but their time zones appear at different positions on the chart.
Fibonacci Time Zone Anchor Explorer
Fibonacci Time Zone Anchor Explorer
Select different starting points on the same price chart. See how the Fibonacci Time Zones shift.
Educational illustration only. Simulated prices are not live market data. Fibonacci Time Zones do not predict price direction or guarantee turning points.
Why Do Fibonacci Time Zones Spread Further Apart?
The zones do not remain equally spaced.
Compare the gaps between consecutive Fibonacci values:
| From | To | Gap |
| 5 | 8 | 3 |
| 8 | 13 | 5 |
| 13 | 21 | 8 |
| 21 | 34 | 13 |
| 34 | 55 | 21 |
| 55 | 89 | 34 |
The distance between later zones becomes increasingly large.
That is why the first few Fibonacci lines can appear crowded near the anchor while later zones spread much further across the chart.
TradingView also notes that the earliest Fibonacci Time Zones are tightly grouped and may sometimes be ignored because later zones provide more separation.
Suggested Read: Supertrend Indicator’s 2 Core Components & the Powerful Setting Behind Clearer Signals
What Is Supposed to Happen at a Fibonacci Time Zone?
This is where explanations of the tool can become misleading.
The common interpretation is that traders watch these intervals for possible changes in price behaviour.
Fidelity describes the method as looking for significant price changes near the vertical lines. TradingView says the zones are intended to identify possible areas of importance based on elapsed time.
But a Fibonacci Time Zone does not directly identify:
- a rally
- a fall
- a reversal
- a breakout
- a support level
- a resistance level
- a price target
- the size of the next move
Think of the information contained in the line this way:
| Question | Information Provided |
| When? | A Fibonacci-derived time interval |
| Where? | No specific price |
| Bullish or bearish? | Not specified |
| How large could the move be? | Not specified |
A vertical line may tell you that a particular Fibonacci interval has arrived.
The market still has to tell you whether anything meaningful is actually happening.
Suggested Read: Elder’s Triple Screen System: The 3 Timeframe Check Before Every Trade
Can Fibonacci Time Zones Predict Reversals?
Suppose you plot seven Fibonacci Time Zones on a completed historical chart.
You notice:
- two lines sit close to major swing points
- one appears near a sharp increase in volatility
- four appear near nothing particularly unusual
It is tempting to focus on the first three.
Those are the visually impressive examples.
But before calling them successful predictions, several questions need answers.
How was the anchor selected?
Was it defined beforehand or chosen because it made the later lines look accurate?
What counts as a reversal?
Is one red candle enough? Does the market need to reverse for two sessions? Does it need to form a confirmed swing?
How close does the move need to be?
Does a reversal two candles before the zone count?
What about three candles after it?
Were failed zones recorded?
Ignoring zones where nothing happened would make the technique look more successful than it was.
These issues are not unique to Fibonacci.
Financial research has long recognised the problem of data snooping, where many possible trading rules are examined and the rules that fit historical data best are then selected. Sullivan, Timmermann and White studied this problem across a large universe of technical trading rules using 100 years of Dow Jones data. Their work highlights why historical fit needs to be evaluated while accounting for the number of rules or variations tested.
For Fibonacci Time Zones specifically, strong direct peer-reviewed evidence establishing the technique as a standalone market-timing predictor appears limited.
So, seeing several historical reversals close to Fibonacci lines is interesting.
It is not enough by itself to establish predictive ability.
The Tolerance Problem: How Close Is Close Enough?
Fibonacci Time Zones highlight periods when the market might experience a turning point. But what happens if the price changes direction a few candles before or after the predicted zone?
For example, suppose a 55-period Fibonacci Time Zone falls on Candle 55.
- If the market turns on Candle 55, it’s an exact match.
- If it turns on Candle 54, it’s still quite close.
- If it turns on Candle 57, some traders might still count it.
- But what about Candle 60? Is that close enough?
This is where tolerance comes in.
Tolerance refers to how many candles before or after a Fibonacci Time Zone a trader is willing to accept as a match.
Example 1: ±1 Candle Tolerance
If the Fibonacci Time Zone falls on Candle 55, a tolerance of ±1 candle means the market can turn on:
Candle 54, 55, or 56
That’s 3 possible candles that qualify as a match.
Example 2: ±3 Candle Tolerance
With a tolerance of ±3 candles, the acceptable range becomes:
Candle 52, 53, 54, 55, 56, 57, or 58
Now, 7 possible candles qualify as a match.
That’s more than twice the number of opportunities compared to the first example.
Do the Time Zones Actually Match?
Do the Time Zones Actually Match?
Adjust the anchor, Fibonacci zones and tolerance. Compare the projected bars with predefined historical swings.
Choose a starting candle from Bar 0 to Bar 20.
Simulated price history. Bars with green markers represent fixed historical swings.
| Zone | Projected Bar | Nearest Swing | Distance | Within Rule? |
|---|
Educational use only. This simulator uses artificial price history and predefined swing points. It does not validate predictive performance or provide trading signals.
Does the Chart Timeframe Change Fibonacci Time Zones?
Yes. Fibonacci Time Zones are based on the number of candles, so their timing changes with the chart timeframe.
For example, consider a 34-period Fibonacci Time Zone:
- 5-minute chart: 34 × 5 = 170 minutes
- 15-minute chart: 34 × 15 = 510 minutes
- Daily chart: 34 candles = 34 trading sessions
This means the same Fibonacci interval can point to different times depending on the chart.
The position of a Fibonacci Time Zone depends on three factors:
- Anchor: Where you start measuring.
- Timeframe: The duration of each candle.
- Fibonacci interval: The number of candles being counted.
The key takeaway: Changing the timeframe or starting point changes where the Fibonacci Time Zones appear. For reliable backtesting, choose a timeframe in advance rather than switching charts to find the best historical matches.
write in a table
Fibonacci Time Zone vs Trend-Based Fibonacci Time
| Feature | Fibonacci Time Zone | Trend-Based Fibonacci Time |
| How it works | Places vertical lines at Fibonacci intervals from a selected starting point. | Measures the time between two selected points and uses it to calculate Fibonacci time levels. |
| Starting point | Requires one starting point (anchor). | Requires two points to measure a price move. |
| Calculation | Uses Fibonacci intervals such as 13, 21, 34, 55 and 89 candles. | Applies Fibonacci ratios to the duration of the selected move. |
| Example | A 34-period zone appears 34 candles after the anchor. | If a move lasts 20 candles, the tool uses that duration to calculate future time levels. |
| Purpose | Highlights potential periods when market turning points may occur. | Highlights potential turning points based on the duration of an earlier market move. |
The key takeaway: Fibonacci Time Zones count candles from a starting point, while Trend-Based Fibonacci Time uses the duration of a selected move to calculate future time levels.
How to Read Fibonacci Time Zones Without Treating Them as Trading Signals
Suppose a later Fibonacci Time Zone is approaching.
The line itself does not confirm that a trade should be taken.
Instead, it can act as a predefined point where you inspect what the market is actually doing.
Market Structure
Has price broken a previously defined swing high or low?
Volatility
Has the trading range expanded compared with recent candles?
Volume
Has trading activity changed around the period?
Momentum
Has the strength or speed of the existing move changed?
Price Location
Is price already interacting with an independently identified support, resistance or previous swing?
This separates the mathematical time marker from the actual behaviour of the market.
The Fibonacci line provides the time reference. The chart provides the evidence.
Interactive Tool: Fibonacci Time Zone Evidence Explorer
This simulator teaches readers how to use Fibonacci Time Zones as observation points rather than buy or sell signals.
Readers can select a Fibonacci zone, examine the chart, and investigate five factors: market structure, volatility, volume, momentum, and price location.
The simulator uses three illustrative market scenarios. Each one shows different price behaviour around a Fibonacci Time Zone, helping readers understand why the vertical line alone is not enough to make a trading decision.
Fibonacci Time Zone Evidence Explorer
A Fibonacci Time Zone marks a point in time, not a trading signal. Select a zone and examine what the market is doing around it.
Step 1: Select a Fibonacci Time Zone
Inspect the market around Bar 21.
The price and volume history remain the same when you switch zones. Only the observation point changes.
Step 2: Examine the Market Evidence
Click each factor to reveal what is happening near the selected Fibonacci Time Zone.
Step 3: Interpret the Evidence
Examine all five factors to see how the selected Fibonacci Time Zone can be interpreted.
The chart provides the evidence.
Educational illustration only. All price, volume and market observations are simulated. The examples are not trading recommendations. No combination of these observations guarantees future price movement.
Note: This simulator is only for learning purposes and doesn’t replicate actual market conditions.
How the simulator teaches the concept
| Selected zone | Market behaviour illustrated | What the reader learns |
| Zone 21 | Sideways movement with limited supporting evidence | A Fibonacci line can appear without meaningful confirmation. |
| Zone 34 | Stronger momentum, increased volume and a possible structural break | Market observations can coincide with a zone without proving the zone predicted the movement. |
| Zone 55 | Price near a reference level, but mixed evidence | Being near support or resistance does not confirm a reversal. |
The simulator keeps the price chart unchanged when readers switch zones. It also requires them to examine all five factors before revealing the interpretation.
Limitations of Fibonacci Time Zones
- Anchor Sensitivity: Different starting points create different future zones.
- Timeframe Sensitivity: A Fibonacci interval on a 5-minute chart represents a very different period from the same interval on a daily chart.
- No Direction Information: The tool does not indicate whether price should rise or fall.
- No Price Target: A vertical Fibonacci line contains no support, resistance or target price.
- Tolerance Can Be Subjective: Increasing the acceptable number of bars around a zone makes historical matches easier to find.
- Hindsight Can Improve the Chart: Selecting anchors, timeframes or tolerance levels after seeing the outcome can make a weak relationship appear stronger.
- Markets Respond to New Information: Earnings, economic data, central-bank decisions, geopolitical events and other new information can affect prices regardless of where a Fibonacci Time Zone appears.
How to Backtest Fibonacci Time Zones
Backtesting helps you understand how often Fibonacci Time Zones align with historical market turning points.
For a fair test, set your rules before analysing the chart.
Step 1: Set Your Backtesting Rules
- Market: Nifty 50
- Timeframe: Daily chart
- Starting point: A confirmed 20-bar swing low
- Fibonacci zones: 13, 21, 34, 55 and 89
- Swing definition: Use the same rule to identify highs and lows throughout the test.
- Tolerance: ±2 candles
- Test period: Select a fixed historical period.
- Record results: Include both matches and non-matches.
Step 2: Calculate Historical Alignment
Once you’ve tested the zones, calculate how many appeared close to a market swing.
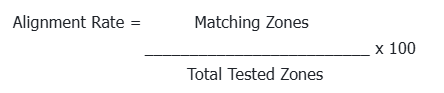
For example, if 20 out of 50 zones fall within ±2 candles of a swing, the historical alignment rate is 40%.
However, this doesn’t mean the tool is 40% accurate at predicting market movements.
Step 3: Compare With Non-Fibonacci Intervals
To understand whether Fibonacci numbers offer any advantage, compare them with nearby non-Fibonacci intervals.
| Fibonacci Intervals | Comparison Intervals |
| 13 | 12 |
| 21 | 20 |
| 34 | 33 |
| 55 | 54 |
| 89 | 88 |
Keep the market, timeframe, starting points, swing definition, tolerance and test period identical for both sets.
If both produce similar alignment rates, Fibonacci intervals may not offer a meaningful advantage over ordinary time intervals.
Step 4: Check Whether the Results Hold Up
A pattern that works on historical charts may not work on new data.
To reduce misleading results, test the same rules on a separate period that wasn’t used to develop or adjust them.
The key takeaway: A reliable backtest records every result, compares Fibonacci zones against a fair alternative, and tests whether historical patterns hold up on new data.
Bottom Line
Fibonacci Time Zones are often presented as a way to forecast when the next market reversal could occur.
What the tool actually provides is narrower.
It divides the chart into Fibonacci-based time intervals.
It does not specify price, direction, magnitude or whether a meaningful market event must occur when a line appears.
The bigger challenge is testing whether the apparent historical matches survive consistent rules for anchor selection, timeframe, swing definition and tolerance.
So, instead of treating every Fibonacci line as a countdown to the next market move, it may be more useful to treat it as a time marker that still needs evidence from price behaviour.
And if the method is going to be judged, the unsuccessful zones matter just as much as the impressive ones.
Disclaimer: This article is for educational and informational purposes only and does not constitute investment advice or trading recommendations. Fibonacci Time Zones do not guarantee market reversals or predict future price movements. Charts, calculations, and interactive simulations are illustrative and may use simulated data. Historical patterns and backtesting results do not guarantee future performance. Always conduct your own research and consult a SEBI-registered investment adviser before making investment decisions.
FAQs
What Are Fibonacci Time Zones?
Fibonacci Time Zones are vertical chart lines placed at Fibonacci-number intervals such as 8, 13, 21, 34 and 55 periods. They mark positions along the time axis and do not independently provide a price target or market direction.
How Do You Calculate Fibonacci Time Zones?
Select a starting chart bar and count forward using Fibonacci-number intervals. For example, from Bar 100, the 21-period zone occurs at Bar 121 and the 34-period zone at Bar 134.
Can Fibonacci Time Zones Predict Market Reversals?
Fibonacci Time Zones are used to identify possible time windows for observing price behaviour, but they do not guarantee reversals. Their results also depend on anchor selection, timeframe and how closely a market move must occur to the projected line.
Which Timeframe Is Best for Fibonacci Time Zones?
There is no universally established best timeframe. The same Fibonacci number represents different real-world durations on 5-minute, hourly and daily charts, so the chosen timeframe should remain consistent when analysing or backtesting the method.