
Before the market opens, every intraday trader wants to know one thing: will Nifty trend strongly, move sideways, or keep swinging around the same levels?
The Central Pivot Range, better known as CPR, tries to bring some structure to this uncertainty.
CPR creates a small price zone using only three numbers from the previous trading session: the high, low and close. That zone is ready before the next session begins.
But CPR is not a crystal ball.
It cannot tell you exactly where Nifty will go. What it can do is help answer three useful questions:
- Was the previous close balanced or stretched?
- Is today’s CPR unusually narrow or wide?
- Is there an older CPR zone that price has never touched?
That brings us to three terms you will hear often: narrow CPR, wide CPR and virgin CPR.
Let’s understand what narrow CPR, wide CPR and virgin CPR actually mean, how they differ, and what they can reveal about the next Nifty session through this blog.
What Is the CPR Indicator?
CPR stands for Central Pivot Range.
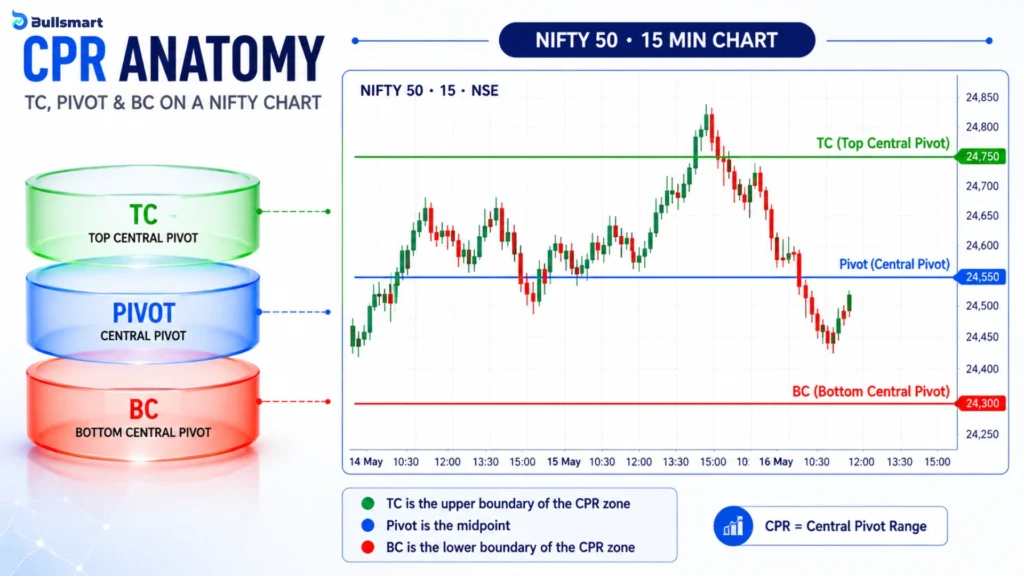
It contains three price levels:
- TC: Top Central Pivot
- Pivot: The middle level
- BC: Bottom Central Pivot
For daily intraday CPR, these three levels are calculated from the previous trading day’s high, low and closing price.
Think of CPR as a small central zone on the chart rather than a single line.
That is one reason it differs from a normal pivot point. Instead of giving only a central pivot, CPR places another level above and below it.
Where Did CPR Come From?
The history is slightly more complicated than saying one person “invented CPR.”
Frank Ochoa, author of Secrets of a Pivot Boss, says he first learned the pivot range concept through Mark Fisher’s The Logical Trader. Fisher used the outer boundaries of the range. Ochoa added the central pivot point to his own analysis and developed several ways of studying the range, including pivot width analysis.
That width is where CPR starts getting interesting.
Suggested Read: 4 Reasons Nifty Fake Breakouts Hit Your Stop-Loss and Reverse
CPR Formula: How TC, Pivot and BC Are Calculated
Here is how the three CPR levels are calculated using the previous session’s high, low and close.
Central Pivot
Pivot = (High + Low + Close) ÷ 3
Bottom Central Pivot
BC = (High + Low) ÷ 2
Top Central Pivot
TC = (2 × Pivot) − BC
Here:
- High is the previous session’s high
- Low is the previous session’s low
- Close is the previous session’s closing price
These are the standard formulas commonly used to calculate the Central Pivot Range.
Now comes a small detail that causes plenty of confusion.
Why Can TC Sometimes Be Below BC?
You would naturally expect something called “Top Central” to always calculate above “Bottom Central.”
The maths does not always cooperate.
Depending on where the previous session closed, the TC formula may produce the lower number while the BC formula produces the higher number.
The usual charting convention is simple:
- The higher value is displayed as TC.
- The lower value is displayed as BC.
So, TC and BC describe the final upper and lower boundaries of the CPR zone, regardless of which formula initially produced the higher number.
Suggested Read: How Does Batman Trading Strategy Work? Why Sell 2 Options Against 1?
What Does CPR Width Actually Measure?
This is where many CPR explanations become too casual.
You will often read: Narrow CPR means low volatility.
That is not quite accurate.
CPR width is simply the distance between TC and BC:CPR Width = |TC − BC|
But the formula can be simplified further.
First calculate the middle of the previous day’s full high-low range: Range Midpoint = (High + Low) ÷ 2
Then:CPR Width = ⅔ × |Close − Range Midpoint|
In short, CPR width mainly shows how far the previous session’s closing price was from the midpoint of that session’s high-low range.
So:
- Close near the middle of the range means a narrow CPR.
- Close farther away from the middle means a wider CPR.
This distinction matters.
A day can have a fairly large high-low range and still produce a narrow CPR if the market closes near the middle.
So CPR width should not be treated as a direct measurement of total daily volatility.
Suggested Read: Ichimoku Cloud Trading Strategy & 7 Crucial Signals for Indian Markets
How to Compare CPR Width
You can also express CPR width as a percentage: CPR Width % = CPR Width ÷ Pivot × 100
This can make historical comparison easier because Nifty at 12,000 and Nifty at 24,000 should not automatically be judged using the same number of points.
There is also no universal official cutoff that says, for example, anything below 0.2% is narrow and anything above 0.5% is wide.
Ochoa’s original pivot-width framework repeatedly uses the word “extremely” and says the range should look abnormally narrow or wide compared with normal conditions.
That makes relative comparison more sensible than blindly following a fixed number.
What Is a Narrow CPR?
A narrow CPR is one where TC and BC are unusually close together compared with recent CPR ranges.
Mathematically, this means the previous session closed relatively close to the midpoint of its high-low range.
Why does this matter?
In traditional CPR width analysis, an extremely narrow CPR is treated as a sign that traders should be alert for a possible expansion or trending session next.
A narrow CPR often follows a session where the closing price was relatively balanced around the middle of the day’s range.
However, this is only a market setup, not a prediction. A narrow CPR does not guarantee that the next session will trend.
One important point is that a narrow CPR does not tell you the direction.
A narrow CPR is not automatically bullish. It is also not automatically bearish.
The width tells you nothing about whether a possible expansion will happen upward or downward. That part has to come from how Nifty behaves during the new session.
Useful things to observe include:
- Whether Nifty stays above TC
- Whether Nifty stays below BC
- Whether price breaks out and quickly returns inside CPR
- How price behaves around the previous day’s high and low
So, think of a narrow CPR as a signal to be alert for possible movement, not as a guarantee that Nifty will move in a particular direction.
Suggested Read: RSI Divergence in Nifty Options: Meaning, Signals & 7 Common Mistakes
What Is a Wide CPR?
A wide CPR means TC and BC are farther apart than usual.
From the formula, this tells us that the previous session closed farther from the midpoint of its high-low range.
In Ochoa’s pivot-width approach, an extremely wide CPR is associated with a greater possibility of the next session becoming sideways or rotational rather than strongly directional.
The thinking is simple.
A session that has already pushed strongly in one direction may sometimes be followed by a session where price spends more time balancing.
But “sometimes” is doing a lot of work there.
Wide CPR does not guarantee a sideways market.
Overnight news, policy announcements, global market moves, gaps and fresh buying or selling pressure can easily produce another directional day.
| CPR Type | What the Maths Tells You | What Practitioners Watch For | What It Cannot Tell You |
| Narrow CPR | Close was near the range midpoint | Possible expansion or trend | Direction |
| Wide CPR | Close was farther from the midpoint | Possible rotation or range | Guaranteed sideways movement |
The word to remember is possible.
What Is Virgin CPR?
Now for the interesting one.
A virgin CPR is a CPR zone that price never touched during the session for which that CPR was calculated.
For example, if the entire session remains below that day’s BC, the CPR zone above price remains completely untouched.
That untouched CPR can continue to be marked on future charts as a historical reference zone.
Some traders watch such zones to see how price behaves if it reaches them later.
But two things are important:
- Price does not have to return to a virgin CPR.
- Price does not have to reverse when it reaches one.
Virgin CPR is an untested historical price zone, not an unpaid bill that the market must come back and settle.
You may also come across claims online that a virgin CPR has a particular percentage chance of being revisited. Unless that percentage comes from a clearly defined and independently verifiable dataset, it should not be treated as a fact.
Narrow, Wide and Virgin CPR: What Each Tells You
It becomes much easier when you stop mixing the three ideas together.
| CPR Feature | What It Helps You Understand |
| CPR width | Where the prior close sat relative to the day’s range |
| Narrow CPR | Whether an expansion-type session may be worth watching |
| Wide CPR | Whether more rotational behaviour may be worth watching |
| Virgin CPR | Whether an older CPR remains completely untested |
| Price above or below CPR | Current directional bias around the zone |
The simple version is:
- Width helps describe possible day type.
- Price location helps describe bias.
- Virgin CPR marks an untested historical zone.
None of them is a complete trading signal on its own.
How Traders Read Nifty Relative to CPR After the Market Opens
CPR becomes more useful once the new session actually begins.
Nifty Trades Above TC
When Nifty trades and holds above the upper boundary of CPR, it is commonly read as a bullish intraday bias.
The CPR zone below price may then act as a reference area for possible support.
However, simply moving above TC is not enough by itself. Traders generally watch whether price can stay above the level and whether the broader price action supports the move.
Nifty Trades Below BC
The opposite applies below BC.
When Nifty trades and stays below the lower CPR boundary, it is generally read as a bearish intraday bias.
In this case, the CPR zone above price may act as a possible resistance area.
Again, the key word is bias. Trading below BC does not guarantee that Nifty will continue falling.
Nifty Keeps Trading Inside CPR
When price remains inside the CPR band, the market has not clearly established control on either side.
This type of price behaviour is generally associated with balance, indecision or range-bound trading until price begins to hold outside the CPR zone.
That is why simply seeing price touch a CPR level is not enough.
What price does around the level matters more than the touch itself.
Nifty 50 Example: Calculating CPR and Finding a Virgin CPR
The following Nifty 50 example shows how CPR is calculated and how a virgin CPR can be identified.
Using the high, low and close from 11 August 2026:
- High: 24,576.85
- Low: 24,429.25
- Close: 24,471.70
These values are then used to calculate the CPR for the next trading session.
Step 1: Calculate Pivot
Pivot = (High + Low + Close) ÷ 3
Pivot = (24,576.85 + 24,429.25 + 24,471.70) ÷ 3
Pivot = 24,492.60
Step 2: Calculate BC
BC = (High + Low) ÷ 2
BC = (24,576.85 + 24,429.25) ÷ 2
BC = 24,503.05
Step 3: Calculate TC
TC = (2 × Pivot) − BC
TC = (2 × 24,492.60) − 24,503.05
TC = 24,482.15
Remember the naming rule.
The higher boundary becomes TC and the lower one becomes BC.
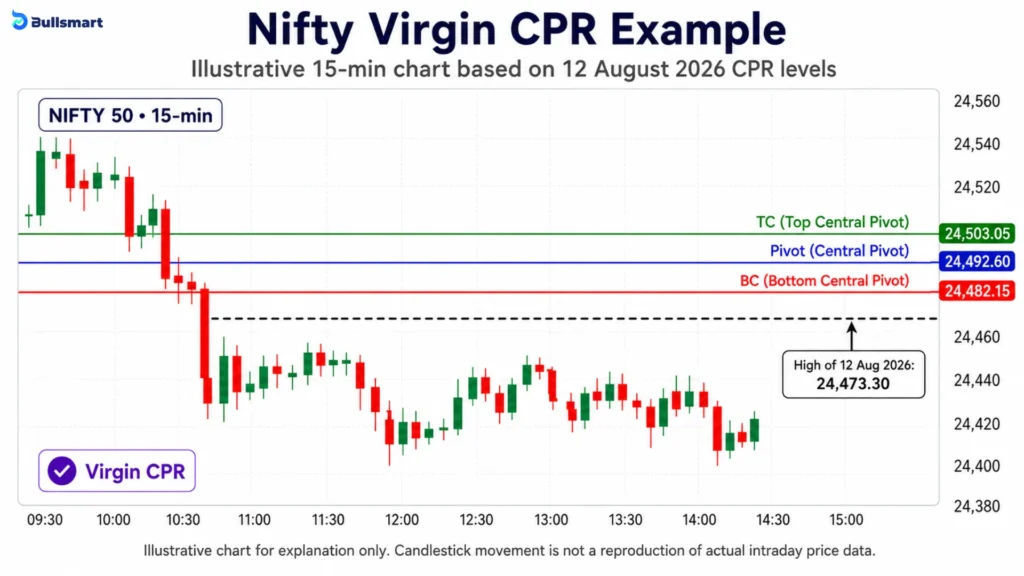
So the plotted CPR for 12 August 2026 was:
- TC: 24,503.05
- Pivot: 24,492.60
- BC: 24,482.15
Now look at what actually happened.
Nifty’s high on 12 August 2026 was 24,473.30. That was still below BC at 24,482.15.
So Nifty never entered that CPR zone.
That day’s CPR therefore remained virgin.
This does not imply that Nifty must return to the zone later. It simply confirms that the CPR remained untouched during that session and can therefore be classified as a virgin CPR.
A Simple CPR Framework for Intraday Nifty Trading
Instead of treating CPR like a magic signal, use it as a checklist.
Calculate the New CPR
Use the previous completed session’s official high, low and close.
Most charting platforms do this automatically.
Check the Width
Compare today’s CPR width with recent CPR widths.
Is it obviously narrow, obviously wide or fairly normal?
Do not force every day into a special category.
Mark Nearby Virgin CPR Zones
If an older CPR was never touched, keep it visible as a reference zone.
Do not treat it as a guaranteed target.
Mark the Previous Day’s High and Low
These give you more context around the CPR.
CPR should not exist alone on an empty chart.
See Where Nifty Opens and Trades
Is price above TC, below BC or inside the CPR?
The answer gives you early context, not a final decision.
Wait for Confirmation
Watch whether price stays outside CPR, rejects the zone or keeps moving back and forth through it.
CPR is generally more useful when it is studied together with price structure, momentum and volume rather than being treated as a standalone signal.
Confirmation can help separate a meaningful move from a brief breakout or false move.
Decide Risk Before Entering
CPR can show you useful reference levels.
It cannot tell you how much money you should risk.
That decision needs to exist before the trade.
How the 2026 Closing Auction Session Affects Nifty CPR Calculations
CPR depends on the previous day’s closing price, so using the correct official close matters.
India’s closing process changed on 3 August 2026.
NSE introduced the Closing Auction Session, or CAS, for cash-market stocks on which derivatives are available. Under the new system, eligible stocks enter a dedicated closing auction from 3:15 pm to 3:35 pm, and the equilibrium price from that auction is used to determine the official closing price.
The NSE circular confirms that the new trading modalities went live from 3 August 2026.
For CPR users, the lesson is simple:
Use the final official Nifty HLC data from a reliable source.
Do not manually note down a price before the closing process is complete and assume it is the final close.
Common CPR Trading Mistakes
CPR is straightforward to calculate, but its interpretation requires proper context.
| Mistake | Why It Causes Trouble |
| Assuming narrow CPR is bullish | Width gives no direction |
| Assuming wide CPR means Nifty must stay sideways | Trending sessions can still happen |
| Using random fixed narrow or wide cutoffs | No universal canonical threshold exists |
| Calling CPR width pure volatility | It specifically depends on close versus range midpoint |
| Forgetting TC and BC can swap | The chart may be labelled incorrectly |
| Treating virgin CPR as a guaranteed magnet | Price may never revisit it |
| Trading every CPR crossover | Price can repeatedly cross the zone |
| Ignoring news and overnight gaps | CPR only uses historical HLC data |
| Looking only at successful past examples | This creates hindsight bias |
The key takeaway is that CPR helps organise price information, but it cannot eliminate market uncertainty.
Advantages and Limitations of the CPR Indicator
| Advantages | Limitations |
| Simple formula | Based completely on past prices |
| Levels are known before the session | Cannot predict direction from width |
| Uses objective HLC data | Narrow and wide are relative terms |
| Shows both central zone and width | False breakouts can occur |
| Easy to plot on intraday charts | Virgin CPR has no guaranteed reaction |
| Can add structure to price analysis | Fresh news can overpower old levels |
CPR works best as a framework for reading price, not as a reason to switch off every other part of your analysis.
Bottom Line
CPR looks like three simple horizontal lines, but those lines can tell you quite a lot about how the previous session ended.
A narrow CPR tells you the previous close finished close to the middle of its range. Practitioners use unusually narrow CPRs to watch for possible expansion.
A wide CPR tells you the close finished farther from that midpoint. Extremely wide CPRs are traditionally associated with greater potential for rotational or range-like behaviour.
A virgin CPR simply tells you that an older CPR zone was never touched.
None of these can tell you exactly where Nifty will move next.
That is the key.
The useful part of CPR is not pretending you know tomorrow’s market before it opens. It is arriving with a clear map of important levels and then watching whether actual price behaviour agrees with that map.
In other words, CPR provides the map. Nifty still decides the route.
Disclaimer: This article is for educational and informational purposes only and should not be considered investment or trading advice. Technical indicators may produce false signals, and past market behaviour does not guarantee future results. Investments in the securities market are subject to market risks, read all the related documents carefully before investing.
FAQs
What is a narrow range CPR trading strategy?
A narrow CPR strategy focuses on sessions where TC and BC are unusually close together. Traders watch for possible price expansion outside the CPR, but direction must be confirmed by actual price behaviour after the market opens.
Is CPR a good indicator?
CPR can be useful for identifying important price zones, market bias and possible session characteristics. However, it does not predict direction with certainty and is generally more reliable when used with price action, volume and risk management.
What is Virgin CPR in trading?
A Virgin CPR is a CPR zone that price does not touch during the session for which it was calculated. Traders may continue marking it as a historical reference zone, but price is not guaranteed to revisit it.
How to read CPR indicator?
Read CPR by observing where price is trading relative to TC, Pivot and BC. Price above TC may suggest bullish bias, below BC may suggest bearish bias, while trading inside CPR can indicate balance or indecision.