
Nifty crosses a resistance level. Your stop-loss gets triggered. Then, almost immediately, price turns around and comes back into the old range.
It feels personal. Usually, it is not.
A fake breakout in Nifty is frustrating because the market seems to confirm a move and then takes it back. But there are three different events here:
- Price crosses a level.
- A stop-loss gets triggered.
- The breakout actually holds.
These are not the same thing.
A fake breakout can happen because orders are crowded around an obvious level, normal volatility briefly pushes price through it, or the breakout simply fails to attract enough follow-through.
So before calling every sudden reversal “stop hunting”, it helps to understand what is actually happening.
In this blog, we’ll explore why fake breakouts happen in Nifty, what really triggers your stop-loss, and how to judge a breakout more carefully.
So, let’s get started.
What Is a Fake Breakout in Trading?
A breakout happens when price moves beyond an area traders have been watching, such as support, resistance, a recent high or a recent low.
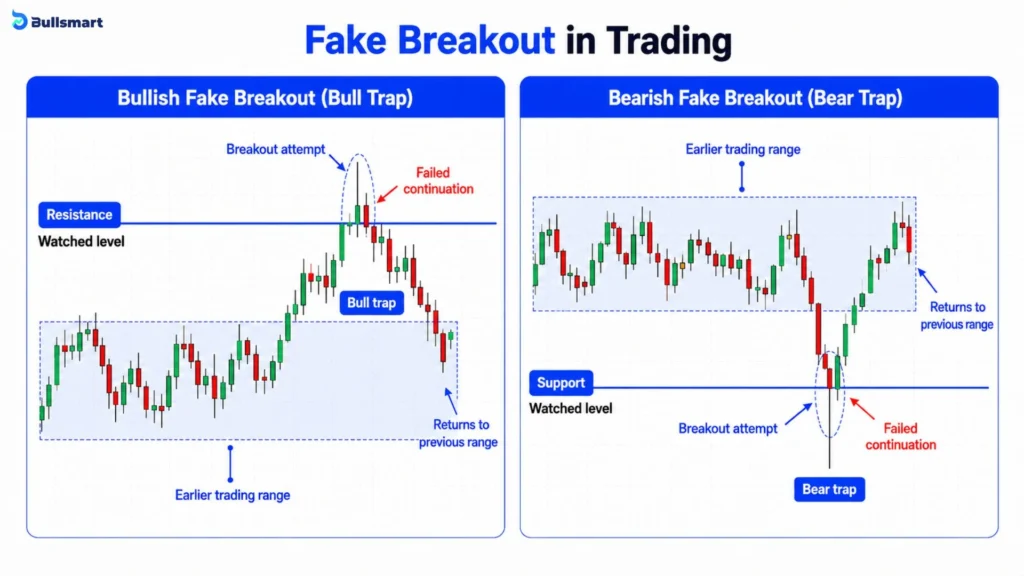
A fake breakout, also called a false breakout or failed breakout, happens when price crosses that area but cannot stay beyond it. Price then moves back into the earlier trading range.
There are two common forms:
- Bullish fake breakout: Price moves above resistance but later falls back below it.
- Bearish fake breakout: Price moves below support but later climbs back above it.
These moves are also often linked with terms such as bull trap and bear trap.
The important word here is failed. Price really did cross the level. What failed was the continuation.
Fake Breakout vs Breakout Retest: What Is the Difference?
Not every move back towards a breakout level is a fake breakout.
| Price Action | What It Means |
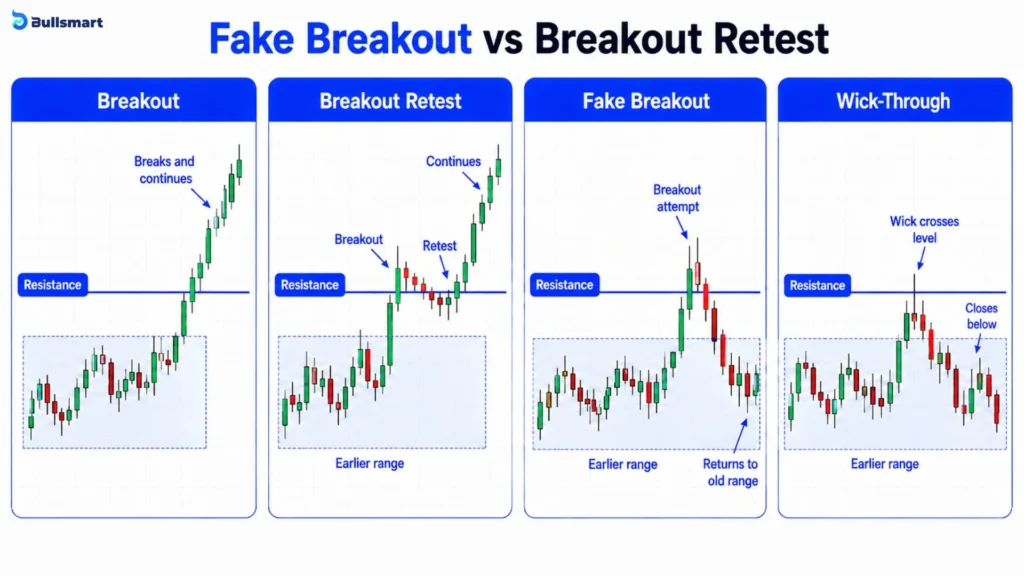
| Price moves beyond the level and continues | Breakout |
| Price breaks the level, returns to test it, then continues | Breakout retest |
| Price crosses the level and returns into the old range | Fake or failed breakout |
| Price only crosses briefly during a candle | Intrabar breach or wick-through |
A retest can happen after a successful breakout. Price may move above resistance, return towards that area, hold above it and then continue higher. A failed breakout behaves differently because price loses the broken area and returns to the previous range.
That is why one wick beyond a line does not tell the entire story.
Suggested Read: PCR and Max Pain: 2 Numbers Traders Watch Closely Near Nifty Expiry
Why Does Nifty Hit Your Stop-Loss and Reverse?
This is where most of the frustration begins. There are several reasons it can happen.
1. Stop Orders Can Cluster Around Obvious Price Levels
Old highs, old lows, support, resistance and round numbers are easy for many traders to notice. Because of this, a large number of orders may be placed around the same price levels.
Research using foreign-exchange order data found that stop-loss orders often gathered around round numbers. Another study found that when many stop-loss orders are triggered together, they can add to a quick and sharp price move.
However, these studies looked at currency markets, not Nifty. They show that stop-loss orders can gather around common levels and affect price movement. But they do not prove that every fake breakout in Nifty happens because institutions are deliberately hunting retail stop-losses.
2. Your Stop Trigger Does Not Require Price to Stay There
This is probably the most important point in the entire discussion.
NSE states that a stop-loss order remains inactive until its trigger price is reached or crossed. Once the trigger condition is met, the order is released into the regular order book.
For a sell stop, the trigger condition is met when the last traded price reaches or falls below the trigger price. For a buy stop, it happens when the last traded price reaches or rises above it.
So price only needs to reach the trigger for the stop condition to activate.
It does not need to stay there. It does not need to continue moving in the same direction.
A stop trigger is a condition. It is not a prediction about what price will do next.
3. The Breakout Does Not Always Continue
Crossing resistance tells us one thing: price traded above resistance.
It does not tell us that buyers will continue buying at higher prices.
If enough fresh buying does not appear, selling pressure can push price back into the old range. The reverse can happen below support when fresh selling fails to continue.
This is why: Price crossed the level is weaker evidence than: Price crossed the level and managed to stay outside the range.
4. Nifty Volatility Changes During the Trading Day
The market is not equally calm throughout every session.
A study using one-minute Nifty 50 futures data from January 2011 to August 2018 found a U-shaped pattern in intraday volatility. Volatility was generally higher near the beginning and end of the trading session than during the middle.
Earlier research using Nifty index data also found higher volatility around the opening period and another rise towards the close.
This matters because a fixed stop distance does not represent the same amount of normal market movement at every point in the day.
Twenty Nifty points are still twenty points. But the market environment around those twenty points can be very different.
Suggested Read: Drawdown in F&O Trading: Why Most Traders Never Recover from a 30% Loss and the Structural Reasons Behind It
Is a Fake Breakout Really Stop-Loss Hunting?
“Stop hunting” is an attractive explanation because it matches how a failed breakout feels.
But there is a large gap between stop clustering and deliberate manipulation.
Research supports the first idea. Stop-loss orders can gather around common levels, and their activation can add to an existing price move.
A chart alone, however, cannot prove that:
- Someone knew a particular trader’s stop price
- A broker deliberately moved Nifty
- An institution specifically targeted that stop
- Every sharp move beyond a high or low was manipulation
There is a major difference between saying: “A lot of orders may have been sitting around this level.”
and saying: “Someone moved Nifty specifically to take my stop.”
The first has evidence behind the general mechanism. The second needs evidence from that specific event.
Stop Clusters Are Real. That Does Not Prove Someone Hunted Your Stop.
That distinction matters because blaming every failed trade on manipulation stops traders from studying the actual breakout.
Sometimes the simpler explanation is enough: price crossed the level, triggered orders and failed to continue.
Why Obvious Support and Resistance Levels Attract So Much Activity
Support and resistance areas matter partly because many people can see them.
Around the same area, there can be:
- Breakout entries
- Stop-loss exits
- Limit orders
- Profit-taking orders
- Orders from traders expecting the level to hold
Technical analysis commonly treats previous highs, lows and other visible chart levels as possible support or resistance. False breaks occur when price moves through such a level but fails to produce enough follow-through.
This is also why support and resistance should not be treated as perfectly precise barriers.
Price can trade slightly beyond an old high or low without establishing a lasting move beyond it.
Think of the level as an area being tested, not a magic number that price is forbidden to cross.
Suggested Read: Supertrend Indicator’s 2 Core Components & the Powerful Setting Behind Clearer Signals
Nifty Spot vs Futures vs Options: Which Price Actually Hit the Stop?
This distinction becomes especially important for Nifty traders.
Nifty 50 is an index made up of 50 stocks. Since June 2009, it has been calculated using a free-float market-capitalisation weighted method. That means every stock does not have the same influence on the index.
NSE also provides futures and options contracts based on Nifty 50.
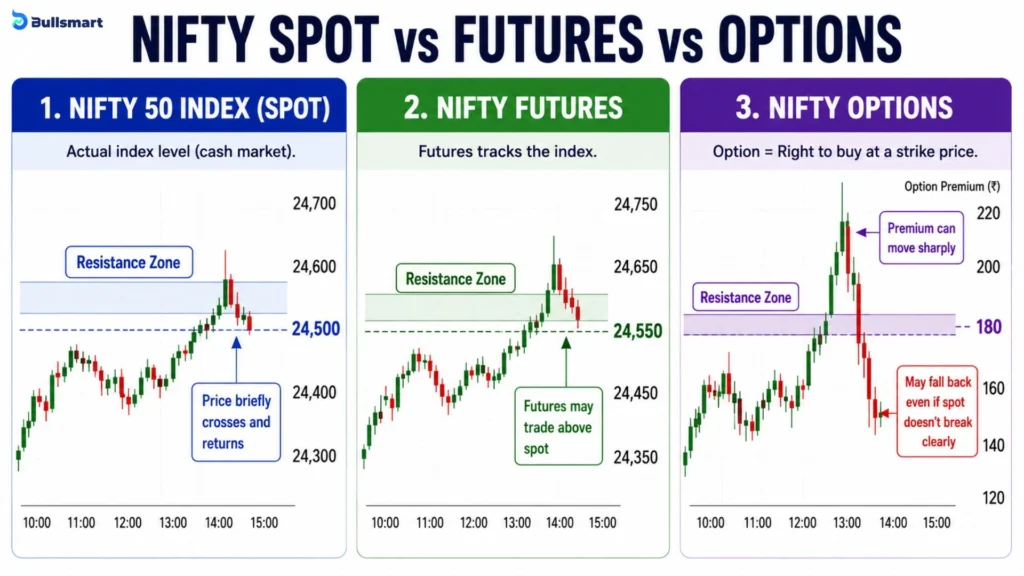
Nifty Futures
Nifty futures are exchange-traded contracts whose underlying is the Nifty 50 index. The futures contract has its own traded price.
Nifty Options
Options add another layer.
A Nifty call or put premium does not move only because Nifty moved.
NSE identifies underlying price, volatility and time to expiry as key factors affecting option values.
So a CE or PE premium touching its stop-loss does not automatically mean Nifty itself reached the technical level used for the trade idea.
Keep these three things separate:
- The Nifty level being analysed
- The futures or option contract being traded
- The price at which the actual stop-loss is placed
Mixing them together can make normal option-premium movement look like a mysterious Nifty fakeout.
How to Identify a Fake Breakout in Nifty
There is no indicator that can identify every fake breakout beforehand.
The better approach is to demand stronger evidence before calling a move a successful breakout.
1. Check Whether Price Closed Beyond the Level
A wick above resistance is different from a completed candle above resistance.
Waiting for price to spend more time beyond the broken level is one of the filters used in technical analysis to judge whether a breakout has held.
A candle close still does not guarantee continuation. It simply gives more information than a brief intrabar touch.
2. Look for Acceptance Outside the Range
Did price continue trading beyond the level?
Or did it immediately return to the old range?
If price quickly moves back into the old range, the breakout may be losing strength.
3. Watch the Retest
Price may return to the broken level after a breakout.
If former resistance starts holding as support, the breakout has survived another test.
If price quickly falls back into the old range, the breakout looks weaker.
4. Check Multiple Timeframes
A move that looks dramatic on a one-minute chart may be tiny on a 15-minute or one-hour chart.
Looking at the larger structure helps show whether the level itself is important or simply part of short-term market noise.
5. Check Participation
Because Nifty 50 is weighted by free-float market capitalisation, some constituents influence the index more than others.
That makes broader participation useful context.
If the index is moving while participation across its stocks remains narrow, that tells a different story from a move supported by many constituents.
It still does not guarantee success.
6. Check the Volatility Environment
India VIX measures expected Nifty volatility over the next 30 calendar days using Nifty option prices.
Higher India VIX means the market is pricing larger expected movement.
It does not tell you whether Nifty will move up or down.
So VIX can provide volatility context. It cannot tell you whether the next breakout will succeed.
Why Volume Alone Cannot Guarantee a Genuine Breakout
Volume can make a breakout look stronger, but it cannot guarantee that the move will continue.
Higher trading activity around a breakout can show that more market participants are involved. But even a breakout with high volume can later fail and reverse.
For Nifty, it is also important to know which volume you are looking at. Nifty 50 itself is an index made up of 50 stocks, while Nifty futures and options are separately traded contracts.
So, traders may look at Nifty futures volume, activity across Nifty 50 stocks, and whether many stocks are moving in the same direction as the index for additional context.
These signals can make a breakout look stronger, but none of them can make it certain.
Volume is supporting evidence, not a guarantee.
Why Putting the Stop “A Few Points Away” Can Still Fail
Moving a stop farther away sounds like an easy solution.
It is not.
A 20-point stop is not automatically too tight. A 50-point stop is not automatically safe.
The meaning of that distance changes with volatility, timeframe and market structure.
There is another problem. If the stop is moved farther away while position size remains unchanged, the possible monetary loss becomes larger.
A better question is: What price behaviour would show that the breakout idea is no longer valid?
The stop-loss can then be placed at a level that shows the breakout has failed, instead of using a random fixed number of Nifty points.
Position size can be considered alongside the resulting risk.
The goal is not to create a stop that can never be hit, because no such stop exists.
The goal is to know why the stop is there.
8 Common Mistakes That Make Fake Breakouts More Painful
- Treating every wick as confirmation: Price touching a level is not the same as sustaining a breakout.
- Entering before the candle is complete: The apparent breakout can disappear before the candle closes.
- Using the same stop distance every day: Volatility changes.
- Treating support and resistance as exact prices: Markets can briefly trade through visible levels.
- Ignoring the higher timeframe: Short-term movement may be insignificant in the larger structure.
- Confusing option-premium movement with Nifty movement: Options have their own pricing factors.
- Assuming high volume guarantees continuation: It does not.
- Calling every stopped-out trade manipulation: A failed breakout alone proves no such thing.
Most of these mistakes come from asking the market for certainty when the market only provides evidence.
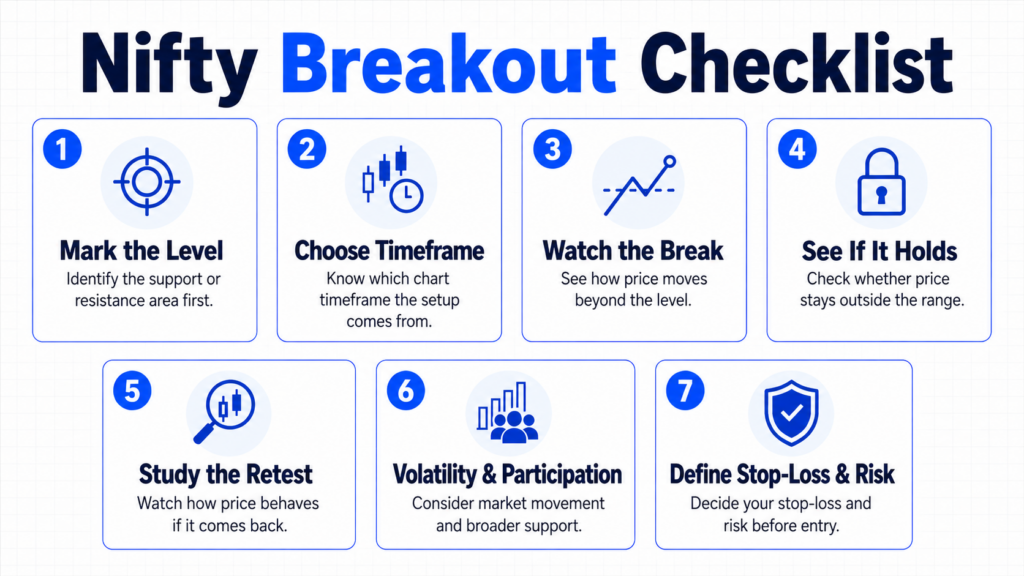
A 7-Step Nifty Breakout Confirmation Framework
Step 1: Mark the Support or Resistance Area
Identify the area before the breakout happens. Do not redraw the important level simply because price has already moved.
Step 2: Choose the Relevant Timeframe
Know whether the setup comes from a 5-minute, 15-minute, hourly or larger chart.
Step 3: Check How Price Breaks the Level
Was there only a wick beyond the level, or did the candle finish outside it?
Step 4: See If the Breakout Holds
Check whether price manages to stay outside the previous range.
Step 5: Evaluate the Retest
If price returns to the broken area, watch whether that area holds or whether price falls straight back into the range.
Step 6: Check Volatility and Participation
Look at the broader market environment rather than judging the breakout from one candle alone.
Step 7: Define Invalidation and Risk Before Entry
Know what price behaviour would make the original idea wrong. Then consider position size around that risk.
Confirmation gives you more evidence. It never gives you certainty.
Can Fake Breakouts Be Completely Avoided?
No.
A breakout can satisfy several confirmation checks and still fail. Higher volume also cannot remove false-breakout risk completely.
Waiting for more confirmation creates its own trade-off. The entry may come later, your stop-loss may need to be placed farther away, or the move may continue without giving a comfortable entry.
There is no universal candle count, stop distance, volume reading or India VIX level that removes fake breakouts.
They are part of market behaviour.
The aim is not to eliminate them. It is to build a process that does not require every breakout to be right.
Bottom Line
A breakout level, a stop trigger and breakout confirmation are three different things.
Nifty can cross a visible support or resistance area, activate nearby orders and then return to its earlier range. That sequence alone does not prove that anybody deliberately targeted a trader’s stop.
A better question is not: “Who hunted my stop?”
It is: “What evidence did I use to call this a real breakout?”
Define the level beforehand. Know whether you are analysing Nifty, futures or an option premium. Separate a quick wick from a sustained break. Check the retest, volatility and participation. Most importantly, decide what would make the trade idea invalid before entering.
You cannot remove fake breakouts from the market.
But you can remove a lot of guesswork from the way you deal with them.
Disclaimer: This article is for educational purposes only and does not constitute investment advice, a trading recommendation or an assurance of returns. Investments in the securities market are subject to market risks, read all the related documents carefully before investing.
FAQs
What is the difference between a fake breakout and a real breakout?
A real breakout moves beyond a support or resistance level and manages to stay outside it. A fake breakout crosses the level but soon returns to the previous range instead of continuing.
How to know if it’s a false breakout?
A breakout may be false if price quickly returns inside the previous range after crossing support or resistance. Candle closes, retests, volume and the larger market trend can provide additional clues, but none offer certainty.
What is the most accurate breakout indicator?
There is no single indicator that can accurately confirm every breakout. Traders often combine price action, volume, support and resistance, volatility and broader market conditions rather than depending on one indicator alone.
How do traders confirm a real breakout?
Traders may look for price to close and stay beyond the breakout level, followed by continued movement or a successful retest. Volume and wider market participation can also provide supporting evidence, but confirmation is never guaranteed.