
Spotting a possible stop hunt after the move is one thing. Knowing where to pay attention beforehand is the harder part.
Traders often use the term when price pushes past an obvious high or low, then quickly returns. But that description can mix up three separate things: stop-loss orders gathering near a level, price crossing it and returning, and a big institution deliberately causing the move. The chart shows the price movement. It cannot prove who caused it or why.
Combining Order Blocks with Candle Range Theory, or CRT, gives you a more structured way to look at it. An Order Block marks an area to watch. CRT provides rules for checking what price does when it reaches that area. Traders call this overlap confluence.
In this blog, we’ll explore how to mark those areas, read the reaction and test the setup, without assuming every sharp move is a deliberate trap.
What Is a Stop Hunt and What Can a Chart Actually Prove?
A stop hunt refers to deliberately pushing price towards a level where stop-loss orders are believed to sit, aiming to trigger them.
Traders also use the term loosely when price crosses a clear high or low and quickly returns. However, that pattern alone does not prove the move was deliberate.
How Do Stop-Loss Orders Get Triggered?
On NSE, a stop-loss order waits in a separate book until its trigger condition is met:
- A sell stop activates when the last traded price reaches or falls below its trigger.
- A buy stop activates when the last traded price reaches or rises above its trigger.
The activated order enters the regular order book. It still needs a matching order to execute.
A triggered stop does not confirm a breakout. Price can briefly reach the trigger and then move back.
Do Stops Gather Around Certain Prices?
Research using currency-market orders found that stop losses can cluster around round numbers. Other research found that stops triggering in succession can accelerate a price move.
These findings do not prove that stops sit beyond every visible Nifty high or low.
What Can a Chart Actually Prove?
A chart can show that price crossed a level and returned. Traders may call this a liquidity sweep.
It cannot independently show whose stops were triggered or whether someone deliberately caused the move. The chart records prices, not intentions.
What Is an Order Block?
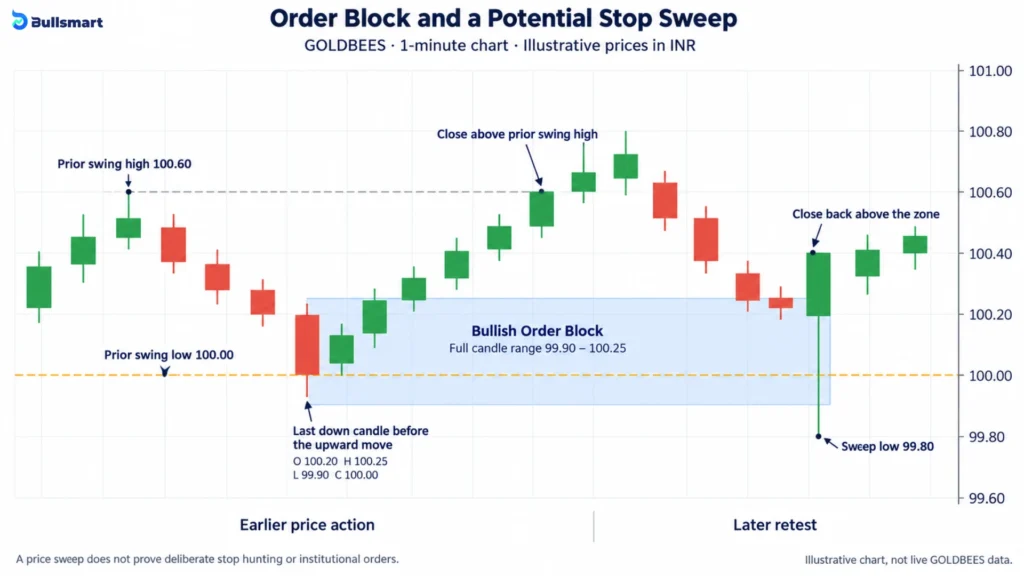
An Order Block is a price area marked from a candle just before a strong move. Traders watch this area to see how price reacts if it returns.
A common way to identify one is:
| Type | Candle to look for |
| Bullish Order Block | The last candle that closed below its opening price before a strong upward move. |
| Bearish Order Block | The last candle that closed above its opening price before a strong downward move. |
Does Every Such Candle Count?
No. Depending on their rules, traders may also look for:
- A break of a previous high or low.
- A sharp move away from the candle.
- A Fair Value Gap, where the first and third candles in a three-candle sequence leave a gap between their wicks.
- A liquidity sweep before the strong move.
There is no single agreed definition. Some traders mark the candle’s full high-to-low range, while others use only its body.
Does It Show Where Institutions Traded?
Order Block theory treats the area as a possible location of large institutional orders. But a candle only shows opening, highest, lowest and closing prices. It does not reveal who placed the orders.
An Order Block gives you an area to watch. It is not proof that institutions bought or sold there.
What Does CRT Add to an Order Block?
An Order Block marks an area to watch. Candle Range Theory, or CRT, helps you assess how price behaves around that area.
CRT starts with a completed candle and marks two levels:
- Candle Range High (CRH): The candle’s highest price.
- Candle Range Low (CRL): The candle’s lowest price.
You then watch whether price crosses either level and closes back inside that range. Under the definition used here, this is called a reclaim.
The two concepts answer different questions:
| Concept | What it helps you check |
| Order Block | Where should I watch for a price reaction? |
| CRT | Did price cross the reference candle’s boundary and close back inside? |
The Order Block zone and the CRT reference range do not have to be identical. One identifies the area of interest; the other provides specific levels for reading the reaction.
Using both gives your analysis more structure. It does not automatically make the setup more reliable or establish a fixed success rate.
Suggested Read: CRT on 1 Minute Charts: Scalping the Fake Breakout That Catches 90% of Retail Traders
How Order Blocks and CRT Work Together
Confluence means using more than one observation to assess a setup. Each part adds information, but there are limits to what it can tell you.
| What you look at | What it tells you | What it does not tell you |
| Previous high or low | Where price reached before | How many stop-loss orders sit nearby |
| Order Block | A price area to watch for a reaction | Whether institutions placed orders there |
| CRT range | The high and low of your reference candle | Which way price will move next |
| Boundary sweep | Price crossed a marked level | What caused the crossing |
| Reclaim | Price closed back inside the reference range | Whether a reversal will follow |
| Volume and order flow | How much trading occurred and, depending on the data, buying and selling activity | Whether someone deliberately manipulated price |
Together, these observations help you describe the setup more clearly. But seeing price cross a level and return is not proof that institutions targeted retail traders’ stops. A normal candlestick chart cannot establish that intent.
How to Map a Potential Stop-Sweep Area Before Price Gets There
The useful part of this framework happens before the sweep: identifying where a future interaction may deserve closer attention.
Step 1: Mark Existing Price References
Begin with levels already created by completed price action, such as:
- Previous swing highs and lows
- Previous session highs and lows
- Closely grouped highs or lows
- Relevant round-number areas
These are visible reference levels, not confirmed stop pools.
Foreign-exchange research provides evidence of stop clustering around round numbers, but that finding should not be converted into an assumption that every visible market level contains a large concentration of stops.
Step 2: Define the Order Block Rule
Decide what qualifies before studying the outcome.
For example, the framework may require the final opposing candle before a move that closes beyond a defined swing.
Also decide whether the Order Block is measured using:
- The full high-to-low range
- The candle body
Changing the definition after seeing the subsequent move creates hindsight bias.
Step 3: Mark the CRT Range
Record the completed reference candle’s:
- CRH
- CRL
These become fixed boundaries against which the later price interaction can be measured.
Step 4: Find the Overlap
The area becomes more relevant to this framework when:
- an existing price reference,
- a predefined Order Block,
- and a CRT boundary
sit close to one another.
Call this a pre-mapped confluence area, not proof of liquidity.
Step 5: Wait for Price Behaviour
Before price reaches the area, no sweep has occurred.
Confluence identifies the area before the event. Price action confirms or rejects the setup afterwards.
Map the area. Then watch the reaction.
Learn Order Block and CRT confluence on a GOLDBEES practice chart. One step at a time.
Start with a low that already exists.
The highlighted 09:19 candle reached ₹100.10. The candles on either side have higher lows, making it a visible swing low. Mark it before revealing any new candles.
The fixed rules used in this lesson
- All prices, times and volumes are invented. GOLDBEES is used as the instrument label; this is not an actual market session or a current quote.
- The 09:19 swing low at ₹100.10 is lower than the lows immediately before and after it. It is known before the replay. Previous session levels and round numbers can also be references, but are not additional evidence in this exercise.
- Our bullish Order Block is the final down-closing candle before the next candle closes above the already-established 09:21 swing high of ₹100.65. It is the 09:23 candle. Choose its full range or body before revealing the future, then keep that choice fixed.
- The completed 09:25 candle is the fixed CRT reference: CRH ₹100.95 and CRL ₹100.05. It is separate from the Order Block candle.
- For this exercise, “nearby” means within ₹0.05. The existing swing low is ₹0.05 above CRL, and both sit in either permitted Order Block zone. This chosen tolerance is not a universal trading rule.
- A bullish reclaim requires the interaction candle to trade strictly below CRL and close strictly between CRL and CRH. A touch alone is not a sweep. A forming candle cannot confirm a reclaim.
- The three replay endings share the same mapped context. They are teaching examples, not a sample from which to estimate a success rate. The chart cannot establish the number of stops or institutional intent.
What Confirms the CRT Part After Price Reaches the Level?
The next stage is based on observable price movement.
Boundary Breach
Price trades beyond the relevant CRH or CRL.
At this point, only one thing is known: the boundary was crossed.
Close Back Inside
Under the CRT definition used here:
Breach + close back inside = reclaim condition
Breach + close outside = no confirmed reclaim
A wick alone therefore does not complete the CRT structure.
Interaction With the Order Block
If the same movement also reaches the previously defined Order Block, CRT and OB traders may describe the event as confluence.
That still does not prove that institutional orders existed inside the block.
Measure What Happens Next
Instead of assuming a reversal, record whether price:
- Holds inside the range
- Reaches the midpoint
- Reaches the opposite boundary
- Returns through the sweep extreme
These outcomes can be measured objectively.
Bullish vs Bearish Order Block + CRT Confluence
| Element | Bullish interpretation | Bearish interpretation |
| External reference | Existing low | Existing high |
| Order Block | Bullish OB nearby | Bearish OB nearby |
| CRT boundary | CRL | CRH |
| Boundary interaction | Trades below CRL | Trades above CRH |
| CRT reclaim | Closes back inside | Closes back inside |
| Opposite reference | CRH | CRL |
| Reversal guaranteed? | No | No |
“Bullish” and “bearish” describe how the framework classifies the structure. They do not guarantee the next price movement.
Why Order Block + CRT Confluence Can Still Fail
Even when an Order Block and a CRT level appear in the same area, the setup can still fail. Both are ways of reading price behaviour, not guarantees of what price will do next.
The Order Block Can Look Obvious Only After the Move
Order Blocks are usually identified from a candle that appears just before a strong move.
The problem is that once the move has already happened, it becomes much easier to look backwards and pick the candle that fits best. This is called hindsight bias.
To avoid this, decide beforehand what qualifies as an Order Block instead of changing the rule from chart to chart.
Traders Do Not All Define an Order Block the Same Way
There is no single universal rule for identifying an Order Block.
Some traders require the move after the candle to break a previous swing high or low. Others also look for a sharp move away from the level, a price gap or imbalance, or a previous liquidity sweep.
Even the zone itself can be drawn differently. Some traders use the candle’s entire high-to-low range, while others use only the candle body. These different rules can produce different Order Blocks on the same chart. (Hadal Instruments)
Crossing a High or Low Does Not Tell You Which Orders Were There
Suppose price moves above a previous high. The chart confirms that the level was crossed, but it does not show how many stop-loss orders were sitting there or who placed them.
NSE explains that stop-loss orders remain in a separate stop-loss book until their trigger price is reached or crossed. Only after being triggered are they released into the regular order book. (NSE)
So a price crossing a level should not automatically be labelled an “institutional stop hunt”.
A CRT Reclaim Does Not Guarantee a Full Reversal
Under CRT, price moving outside a reference range and then closing back inside can be classified as a reclaim.
But the reclaim tells us only what price has already done. It does not guarantee that price will continue all the way to the opposite side of the range.
The opposite boundary should therefore be treated as a possible reference level, not a guaranteed target.
Buy and Sell Pressure Can Change Very Quickly
Orders are constantly entering, changing and being executed in the market. That means the balance between buyers and sellers can change even after a clean-looking setup appears.
A 2021 study examined the 195 most actively traded stocks on the NSE using transaction and order-book data. It found that order imbalance, meaning the difference between buying and selling pressure, contained information about very short-term price movements. The effect was strongest over the first five minutes and faded within about 30 minutes. (Finance Research Letters)
This is why a price zone marked earlier on the chart cannot be assumed to control what happens when price eventually returns to it.
Very Short Timeframes Contain More Market Noise
A 1-minute chart shows price in much greater detail, but every small movement is not necessarily meaningful.
Research on high-frequency market data found that short-term prices are affected by factors such as the bid-ask spread, whether trades are initiated by buyers or sellers, minimum price increments or tick sizes, and the tendency of trades to alternate between bid and ask prices. (Journal of Business & Economic Statistics)
In simple terms, some movement visible on a 1-minute chart can come from the mechanics of trading itself rather than a meaningful change in market direction.
That is why an Order Block + CRT setup should also be checked against the broader market structure instead of relying on one small timeframe alone.
Can Market Depth Reveal a Stop Hunt Beforehand?
Not completely.
NSE states that stop-loss orders remain in the stop-loss book until their trigger condition is met. Only then are they released into the regular order book.
Displayed market depth should therefore not be interpreted as a complete map of dormant stop orders.
NSE provides several levels of real-time data. Level 1 shows the best bid and ask, Level 2 shows up to five bid and ask levels, Level 3 shows up to 20 levels in the capital market, and tick-by-tick data can provide the full active order book.
But even greater order-book depth does not make an untriggered stop a visible regular-book order.
So claims that a standard depth screen can show exactly where retail stops are sitting should be treated cautiously.
Does Order Block + CRT Confluence Actually Work?
There is no credible independent evidence establishing a universal success rate for an Order Block + CRT strategy.
Practitioner websites publish their own tests and performance claims, but the results depend heavily on the exact definitions, instruments, periods, targets, costs and filtering rules used.
The framework is nevertheless testable.
A useful backtest can record:
- Timeframe
- Exact Order Block rule
- OB high and low
- CRH and CRL
- OB-to-CRT distance
- Boundary breached
- Sweep depth
- Close inside or outside
- Maximum favourable movement
- Maximum adverse movement
- Midpoint reached
- Opposite boundary reached
- Invalidation reached
- Transaction costs
This replaces labels such as “strong institutional setup” with measurable conditions.
How to Backtest the Confluence Without Cherry-Picking
Define the rules before reviewing the outcome.
Specify:
- What qualifies as displacement?
- What defines a structure break?
- Which candle becomes the Order Block?
- Is the block based on body or full range?
- How close must the Order Block and CRT boundary be?
- Does an equal high or low count as a sweep?
- When must the reclaim occur?
- How long does the setup remain valid?
- What counts as a successful outcome?
Then record every qualifying setup, including failed Order Blocks, failed reclaims and cases where the opposite CRT boundary is never reached.
A framework cannot be evaluated fairly if its rules change whenever the chart does.
Bottom Line
Order Block + CRT cannot tell traders that an institution is about to hunt their stop.
What it can do is separate two useful questions.
Where is the area worth watching?
Order Blocks and existing price references can help define that location.
What did price actually do there?
CRT can classify the boundary breach, close and reclaim.
A zone can therefore be mapped before price arrives, but the sweep and reclaim must still happen afterwards. That distinction keeps the framework measurable instead of turning every wick into evidence of manipulation.
The goal is not to guess who moved the market. It is to define the price behaviour that would support or weaken the original hypothesis.
Disclaimer: This article is for educational and informational purposes only and should not be considered investment, trading or financial advice. Concepts such as Order Blocks, Candle Range Theory (CRT), liquidity sweeps and stop hunts are trader-defined analytical frameworks and do not guarantee profitable outcomes or prove institutional intent. Trading and investing in securities and derivatives involve market risk. Readers should conduct their own research, consider transaction costs and risk tolerance, and consult a SEBI-registered investment adviser or other qualified professional where appropriate before making financial decisions.
FAQs
What is a stop hunt in trading?
A stop hunt usually refers to price moving through an area where traders believe stop-loss orders are concentrated before reversing. Price action can show the move, but a chart alone cannot establish that another participant deliberately targeted those stops.
What is an Order Block in trading?
In SMC and ICT terminology, an Order Block is commonly the last opposing candle before a qualifying directional move. Traders mark its range as a potential reaction zone, but the candle itself does not prove institutional orders were placed there.
How does CRT work with an Order Block?
An Order Block provides a predefined area to monitor. CRT then evaluates whether price breaches a candle-range boundary and closes back inside it. When both occur around the same area, traders may describe the setup as OB + CRT confluence.
Can Order Blocks and CRT predict stop hunts?
They cannot reliably prove that a future move will occur or establish institutional intent. The combination can help define price zones and measurable reclaim conditions, but its usefulness depends on consistent rules and historical testing.