
Order blocks are often explained as price zones where big institutions built positions before a strong market move. In simple terms, a bullish order block is usually linked to buying before a rally, while a bearish order block is linked to selling before a fall.
But there is a catch.
A candlestick chart can show you what price did. It cannot tell you exactly who was buying or selling, how large an institution’s full order was, or where someone else placed their stop-loss.
What research does show is more useful. Large trades can move prices, institutions often split big orders into smaller ones, order-flow imbalance can help explain short-term price moves, and stop orders can gather around commonly watched price levels.
For example, a study of 195 actively traded NSE stocks found that order imbalance had a persistent relationship with prices and short-term returns. It also found that this information was visible deeper in the order book, not just at the best bid and ask.
So, instead of asking, “Is this candle an institutional order?”, a better question is: Can an order block help us identify strong displacement, liquidity zones and meaningful price reactions in a consistent way?
Let’s dive in.
What Is an Order Block in Trading?
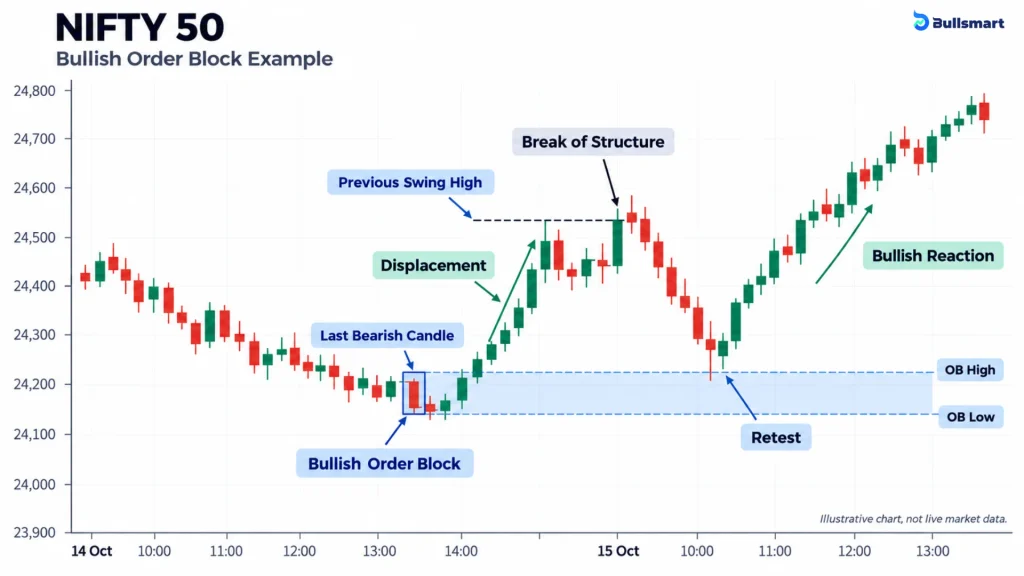
In price-action and Smart Money Concepts terminology, an order block generally refers to a candle or small price zone immediately preceding a strong directional move.
- A bullish order block is commonly identified around the final bearish candle or consolidation before strong upward displacement.
- A bearish order block is commonly identified around the final bullish candle or consolidation before strong downward displacement.
Traders then extend that price range forward and watch how the market behaves if price returns to it.
There is no universally accepted academic definition of an order block, so different traders may use the full candle range, only the candle body or a broader consolidation as the zone.
What an Order Block Does Not Prove
A candlestick alone cannot establish:
- Who traded at that level
- Whether the participant was an institution
- How large the participant’s total order was
- Whether unexecuted institutional orders remain there
- Where an institution placed its stop-loss
This is why an order block should be treated as a price-action framework, rather than direct evidence of institutional inventory.
Suggested Read: 5 Steps to Map Potential Stop Hunts Before They Happen With Order Block + CRT
Types of Order Blocks
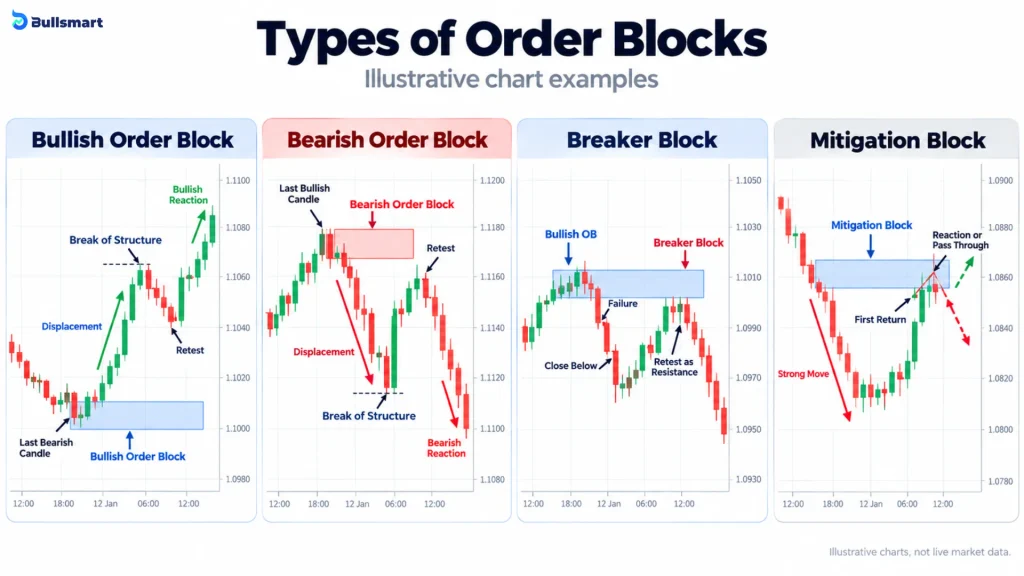
Order blocks are usually grouped by the direction of the move that follows them.
1. Bullish Order Block
A bullish order block is typically marked around the last bearish candle or small consolidation before a strong upward move.
Traders usually look for:
- Strong upward displacement
- A break above a recent swing high
- A later return to the marked zone
- A buying reaction from the zone
The area is then watched as a possible support or demand zone.
2. Bearish Order Block
A bearish order block is usually marked around the last bullish candle or small consolidation before a strong downward move.
Traders commonly look for:
- Strong downward displacement
- A break below a recent swing low
- A later retest of the zone
- A selling reaction from the area
The zone is then watched as a possible resistance or supply area.
3. Breaker Block
A breaker block is an order block that fails and is later watched from the opposite side.
For example:
- A bullish order block fails
- Price closes below the zone
- Price later returns to the same area
- The old bullish zone may then act as resistance
The reverse can happen with a failed bearish order block.
4. Mitigation Block
A mitigation block refers to a zone that price revisits after a strong move.
Traders usually watch:
- The first return to the zone
- How deep price moves into it
- Whether price reacts or moves straight through
The term is common in Smart Money Concepts, but the exact institutional activity behind the zone cannot be confirmed from a candlestick chart alone.
Key Point
Bullish, bearish, breaker and mitigation blocks are trading concepts, not officially defined exchange or academic market-structure categories.
They should be used to organise price action, not as proof that institutional orders are sitting at a particular level.
Suggested Read: 4 Stages of an ICT Liquidity Raid: Do Institutions Really Hunt Your Stops?
Why Can Large Orders Leave a Market Footprint?
Large investors cannot always execute a substantial buy or sell order in one go without affecting the market. If available liquidity is limited, a large order can consume several price levels and move the market against the trader.
1. Large Orders Can Create Market Impact
The effect that a trade has on price is known as market impact.
Its size can depend on factors such as:
- Order size
- Available market depth
- Overall liquidity
- Speed of execution
The larger the trade relative to available liquidity, the harder it can become to execute without influencing price.
Research published in The Review of Financial Studies found that execution becomes particularly challenging when trades are large relative to a stock’s average daily volume, especially in less-liquid securities.
2. Institutions Often Split Large Orders
One way large participants manage market impact is by breaking a large parent order into multiple smaller trades.
Instead of attempting to buy or sell the entire quantity immediately, execution may be spread across time and different price levels.
A peer-reviewed study found that, within its sample, splitting large orders into smaller transactions reduced immediate price-impact costs by approximately 60% to 82% on average compared with executing the equivalent large trade at once.
Institutional order splitting is also directly documented in trading data. A 2023 Journal of Financial Markets study analysed 26,226 institutional parent orders and found that institutions adjusted their execution behaviour as they detected counterparties in the market.
3. This Activity Can Leave Observable Effects
When large orders are executed across multiple transactions, their activity may contribute to observable changes in:
- Price movement
- Trading volume
- Order-flow imbalance
- Available liquidity
- Market depth
These effects provide a legitimate reason for traders to study areas where strong price displacement begins.
4. But a Candle Is Not Proof of Institutional Buying
This is where distinction becomes important.
Evidence that institutions split orders does not prove that the final bearish candle before a rally contains unfinished institutional buy orders.
Similarly, a strong bearish move does not prove that the preceding bullish candle contains institutional selling.
A candlestick chart does not reveal:
- Who placed the orders
- How large the original parent order was
- Whether the trader was an institution
- Whether any unfilled quantity remains at that price
So, while large orders can leave measurable market effects, identifying a specific candle as an institutional order block remains a trading interpretation rather than a directly observable fact.
Suggested Read: 4 Reasons Nifty Fake Breakouts Hit Your Stop-Loss and Reverse
Order Blocks vs Actual Order Flow
The distinction becomes clearer when an order block is compared with real market data.
| Order Block Concept | What Market Data Actually Shows |
| Candle range | Historical open, high, low and close |
| Institutional buying or selling | Requires suitable participant or order-flow data |
| Liquidity | Can be studied through depth, spreads, volume and executions |
| Order imbalance | Difference between buying and selling pressure |
| Hidden liquidity | Orders or quantities not completely displayed |
| Stop placement | Not identifiable from an ordinary candlestick chart |
Hidden liquidity is not theoretical. Research on electronic limit-order books has documented orders whose information is not fully revealed to other market participants. A 2008 study found that hidden-order activity increased around earnings announcements when demand for both information concealment and execution could be high.
An order block is therefore better viewed as a chart-based proxy for an area of interest, not a direct map of institutional order flow.
Order Block Builder
Select the chart conditions and see how that setup could look on an illustrative NIFTY 50 candlestick chart.
1. Build Your Setup
2. What Happened Next?
Bullish Order Block
Important: This is an educational chart simulator. It does not detect actual institutional orders, hidden orders or real stop-loss positions. The NIFTY 50 chart is illustrative, not live market data.
Where Do Stop-Loss Orders Tend to Cluster?
Stop-loss orders are private, so a normal chart cannot show their exact location. But researchers have studied real stop-loss orders to understand where traders usually place them.
Case Study 1: Real Stop-Loss Orders at a Large FX Bank
Researcher Carol Osler studied actual stop-loss and take-profit orders submitted to a large foreign-exchange dealing bank.
The key finding was clear:
Orders were not spread evenly across prices. They were strongly clustered around round numbers.
In simple terms, traders were more likely to place orders around easy-to-remember levels instead of random prices.
For example, in any market, traders may pay more attention to prices such as:
- 100
- 500
- 1,000
- 20,000
rather than unusual levels such as 19,973.
Osler also found that stop-loss buy orders and stop-loss sell orders showed different clustering patterns around these round-number levels.
The important lesson is that many traders can independently choose the same obvious price levels, causing stop orders to build up in the same area.
Case Study 2: What Happened When Price Reached Those Stop Clusters?
Osler later studied what happened when exchange rates moved toward levels where stop-loss orders were already known to be concentrated.
She found that price movements became unusually fast near stop-loss clusters.
The movement linked to stop-loss orders was also larger and lasted longer than the movement linked to take-profit orders.
Why can this happen?
Suppose many traders have sell stop-loss orders around the same level.
When price reaches that area:
- The first group of stop-loss orders gets triggered.
- Those orders add more selling pressure.
- Price may fall further.
- That lower price may trigger another group of stops.
- The move can become faster as more orders are activated.
This is one reason stop clusters can sometimes create sharp price moves.
Important Limitation
These case studies were based on the foreign-exchange market.
They did not study:
- Nifty
- Bank Nifty
- Indian options
- individual NSE stocks
So we cannot say that stop-loss orders in Indian markets cluster in exactly the same way.
What the research does show is simpler:
Stop-loss orders can gather around obvious price levels, and when many of them are triggered together, price can move quickly.
What Does This Mean for Order Block Trading?
When studying an order block, traders often watch nearby levels such as:
- swing highs
- swing lows
- equal highs or lows
- previous day highs or lows
- round-number levels
These levels may attract attention because many traders use the same visible reference points.
But they should be treated as possible stop or liquidity zones, not confirmed institutional stop locations.
Suggested Read: Mean Reversion on Weekly Timeframes: Is Risk-Reward 5x Better Than Intraday Chasing?
Where Could Stops Sit Around an Order Block?
Instead of claiming that a chart reveals exact stop-loss placement, traders can identify areas where stops may plausibly concentrate.
Around a bullish order block, these may include:
- the order block low
- a preceding swing low
- closely grouped or equal lows
- the previous session low
- nearby round-number levels
Around a bearish order block, traders may similarly monitor:
- the order block high
- a previous swing high
- equal highs
- the previous session high
- nearby round numbers
On NSE, stop-loss orders remain in the stop-loss book until their trigger condition is reached. A sell stop is triggered when the last traded price reaches or falls below its trigger, while a buy stop is triggered when price reaches or exceeds its trigger.
Execution price should not automatically be assumed to equal the stop price. FINRA also cautions that market-type stop orders can execute at significantly different prices during fast-moving markets.
How to Identify a Higher-Quality Order Block
There is no objective formula that guarantees a successful order block. A more disciplined approach is to convert the setup into measurable conditions.
Step 1: Identify Meaningful Displacement
Look for a move that stands out relative to recent market activity.
Possible measurements include:
- Candle body relative to Average True Range (ATR)
- Move size relative to recent volatility
- Accompanying volume expansion
A large candle alone should not be labelled institutional buying or selling.
Step 2: Check Market Structure
For a bullish setup, traders may require price to exceed a previously defined swing high.
For a bearish setup, price may need to break a previous swing low.
Define how a swing is identified before analysing the results.
Step 3: Define the Order Block Boundary
Choose a consistent method, such as:
- Full candle: high to low
- Body: open to close
Changing the boundary after seeing whether price reacted introduces hindsight bias.
Step 4: Check Nearby Liquidity References
Look for:
- Previous highs and lows
- Equal highs or equal lows
- Prior-day extremes
- Round numbers
- Consolidation boundaries
These are visible reference points, not proof of actual resting stop quantities.
Step 5: Study the Retest
When price revisits the order block, record:
- Whether it is the first revisit
- Penetration depth
- Traded volume
- Closing position
- Subsequent price movement
First and later retests should be analysed separately instead of assuming they behave identically.
Step 6: Define Invalidation
Examples include:
- Closing completely beyond the block
- Breaking the block by a predefined ATR fraction
- Violating the structural swing
A predefined invalidation rule makes the order block trading strategy testable.
Bullish Order Block vs Bearish Order Block
| Bullish Order Block | Bearish Order Block |
| Precedes upward displacement | Precedes downward displacement |
| Often based on a bearish candle or zone | Often based on a bullish candle or zone |
| Liquidity may be watched below | Liquidity may be watched above |
| Confirmation may require a previous high to break | Confirmation may require a previous low to break |
| Invalidation is commonly below the zone | Invalidation is commonly above the zone |
None of these characteristics, by itself, demonstrates institutional participation.
Order Block vs Supply and Demand Zone vs Fair Value Gap
These terms describe different chart concepts.
| Concept | What It Represents |
| Order Block | Candle or compact zone preceding displacement |
| Supply/Demand Zone | Broader area associated with a previous strong price departure |
| Fair Value Gap | Three-candle imbalance identified from candle extremes |
| Support/Resistance | Historical area where price previously reacted |
An order block and fair value gap can occur in the same area. Their overlap may form part of a trading rule, but one does not scientifically validate the other.
Can Traders Really See Institutional Stop Placement?
Not from an ordinary candlestick chart.
Institutional trading can involve algorithms, parent and child orders, hidden liquidity, brokers and executions distributed over time.
Research documents institutional order splitting, while electronic markets can also contain order information that is intentionally not displayed.
This makes reconstructing one participant’s complete position from candles alone extremely difficult.
A trader can identify possible liquidity zones and logical stop locations based on observable price structure. That is fundamentally different from knowing where a bank, hedge fund or proprietary desk has actually placed its risk.
Order blocks can suggest where liquidity may matter. They cannot reveal somebody else’s trading book.
Why Can Stop Clusters Accelerate Price?
If many stop-loss orders are placed around the same level, price can move quickly once that level is reached.
- Stops begin to trigger: Suppose many sell stop-loss orders are placed below a widely watched low.
- More sell orders enter the market: Once price reaches those stop levels, the stop-loss orders become active.
- Buying liquidity gets used up: The new sell orders may consume the available buy orders at nearby prices.
- Price can fall further: If selling pressure is stronger than the available buying interest, price may move down to lower levels.
- More stops may then trigger: Traders with stop-loss orders slightly lower may also get activated.
- A cascade can form: One group of triggered stops can help push price into the next group of stops, making the move faster.
What Does Research Show?
Carol Osler’s high-frequency foreign-exchange research found that price trends became unusually fast near documented stop-loss clusters. The study concluded that triggered stop-loss orders could help push price trends forward in waves.
This supports the idea of stop-triggered price cascades.
However, it does not prove that every sharp breakout, long wick or sudden reversal is deliberate stop hunting.
Common Order Block Trading Mistakes
- Marking every opposite candle as an order block: Look for displacement, structure break and context first.
- Assuming a large candle means institutional activity: A strong candle shows price movement, not who caused it.
- Changing block boundaries later: Define the zone before the retest to avoid hindsight bias.
- Ignoring market structure and volatility: An order block should not be studied alon.
- Calling every wick “stop hunting”: A wick can also result from volatility, thin liquidity or aggressive orders.
- Ignoring failed setups: Record both successful and failed order blocks.
- Cherry-picking historical examples: Backtest every setup that matches your rules.
- Ignoring trading costs: Slippage, brokerage and other charges can change results.
- Changing entry or stop rules: Use the same rules throughout the test.
The biggest mistake is hindsight. A setup may look obvious after price reacts, but the real question is whether it could have been identified before the move.
How to Backtest an Order Block Strategy
- Define the order block: Use the full high-to-low range of the last opposite-coloured candle before displacement.
- Set the displacement rule: Require price to move at least 1 ATR away from the block.
- Confirm structure break: For bullish setups, price must close above the recent swing high. For bearish setups, below the recent swing low.
- Use the first retest only: Ignore later revisits for the same setup.
- Set the entry: Use the 50% level of the order block.
- Set invalidation: Exit if price closes beyond the opposite edge of the block.
- Set the target: Use a fixed 1:2 risk-reward ratio.
- Record every result: Track target hit, stop hit, no entry and no retest.
- Calculate performance: Measure win rate, average R and expectancy using only triggered trades.
The Risk Reality for Indian Traders
Order block strategies are often used in options and leveraged trading, where losses can build quickly.
SEBI’s August 2026 study found that in FY26:
- 87.7% of individual equity-derivatives traders made net losses
- Their combined net losses reached ₹91,685 crore
- Options contributed 92% of these losses
- Individual traders paid around ₹25,000 crore in transaction costs
An order block can provide a structured way to read price action, but it cannot remove leverage risk, trading costs, slippage or the risk of a failed setup.
Bottom Line
The order block strategy becomes more useful when it is separated from claims that cannot be verified from a chart.
Market microstructure research provides strong evidence for price impact, institutional order splitting, order-flow imbalance, hidden liquidity and stop clustering. These mechanisms help explain why displacement and liquidity matter when studying price behaviour.
What the research does not establish is that the last bearish candle before every rally represents institutional buying, or that a bearish order block reveals the exact location of institutional stops.
That distinction matters.
Rather than treating order blocks as secret maps of institutional positions, traders can use them as a structured framework for defining price zones, market structure, displacement, retests and invalidation. Most importantly, those rules can then be tested against actual market data instead of being accepted because a historical chart looks convincing.
Disclaimer: This article is for educational and informational purposes only and should not be considered investment, trading, or financial advice. Order blocks, stop zones, liquidity areas, and related chart concepts are interpretive trading frameworks and do not confirm institutional activity or future price movement. Market trading involves risk, including the possible loss of capital. Readers should conduct their own research, backtest strategies carefully, consider transaction costs and risk management, and consult a SEBI-registered investment adviser where appropriate.
FAQs
How to Find an Order Block?
Look for the last opposite-coloured candle or small consolidation before a strong price move. Then check whether the move breaks a recent swing high or low. Traders often mark that candle’s range and watch for a later retest. The setup is stronger when displacement, market structure and nearby liquidity levels also support it.
Are Order Block and FVG the Same?
No. An order block is a candle or small zone that appears before a strong directional move. A Fair Value Gap (FVG) is a three-candle price imbalance where part of the price range is not overlapped. They can appear together, but they describe different chart structures and one does not automatically confirm the other.
Which Is the Best Order Block Indicator?
There is no single “best” order block indicator. Most indicators simply apply preset rules to mark possible zones automatically. Their usefulness depends on how those rules define displacement, structure breaks and retests. Traders should understand the logic behind the indicator and test it instead of relying only on automatically highlighted order blocks.
Is Order Block Strategy Profitable?
An order block strategy can be profitable only if its rules show a positive edge after testing. Profitability depends on entry rules, stop-loss placement, market conditions, transaction costs and risk management. An order block alone does not guarantee a successful trade. The strategy should be backtested using consistent rules and both winning and losing setups.