
Two numbers often sit next to each other on an options platform: IV Rank and IV Percentile. Both usually run from 0 to 100. Both compare current implied volatility with its own history. This makes them look like two versions of the same indicator.
They are not.
IV Rank asks, “Where is today’s IV between its historical low and high?” IV Percentile asks, “On how many historical days were IV lower than it is today?” One measures the width of a range. The other counts observations.
That difference can completely change how the options market appears. A reading may look low according to IV Rank but unusually high according to IV Percentile. Neither number is necessarily wrong. They are simply describing the same history from different angles.
These metrics cannot choose an options strategy on their own. They do not predict direction, guarantee that volatility will rise or fall, or prove that an option is overpriced. Their real value is more practical: they place current option premiums in context before direction, expiry, time decay, skew, liquidity and risk are assessed.
In this blog, we will study how IV Rank and IV Percentile are calculated, why they can give different readings and how to use both while evaluating options strategies.
What Is Implied Volatility in Options Trading?
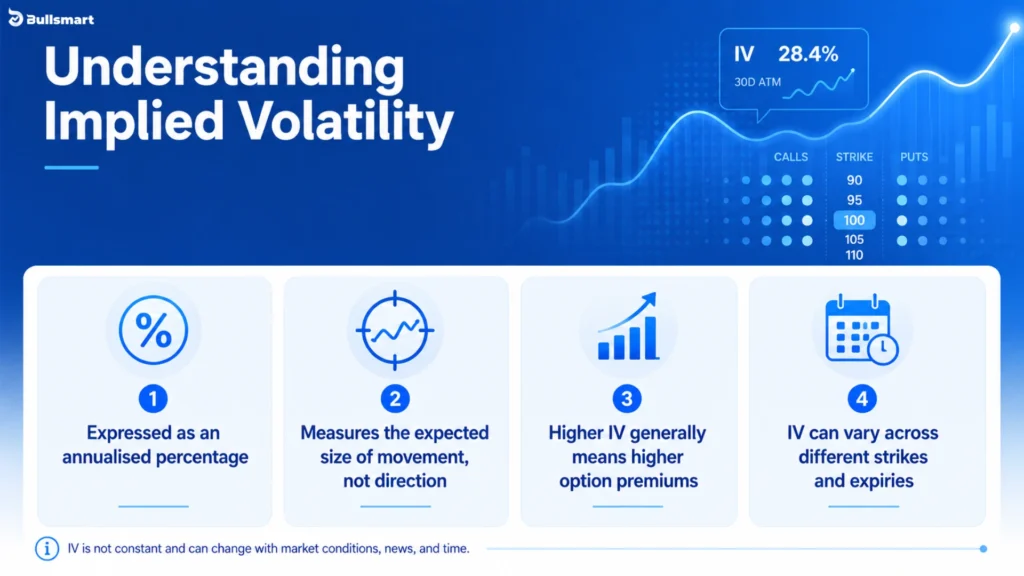
Implied volatility, or IV, is the volatility level derived from current option prices. It represents the market’s estimate of how widely the underlying asset may move over a future period.
Suggested Read: India VIX Rising Volatility Signals Growing Global Market Fear
What Does Implied Volatility Measure?
IV measures expected price variability, not direction. A market expecting a large move can push up the IV of calls and puts at the same time.
IV mainly affects an option’s extrinsic value. This is the portion of an option’s premium above its intrinsic value. A rise in IV can increase extrinsic value even when the underlying price does not move.
Vega measures how sensitive an option’s premium is to a one-percentage-point change in IV. Longer-dated options generally have greater vega than shorter-dated options. The same change in IV may therefore have a larger effect on a longer-dated option.
| Measure | What It Tells You |
| Implied volatility | The variability reflected in current option prices |
| Historical volatility | How much the underlying actually moved in the past |
| IV Rank and IV Percentile | Where current IV sits relative to its own history |
Historical volatility looks backwards. Implied volatility looks forwards. IV Rank and IV Percentile add historical context to that forward-looking IV number.
Suggested Read: 4 Powerful Nifty OI Signals Explained: Long Buildup, Short Buildup, Short Covering & Long Unwinding
What Is IV Rank in Options Trading?
IV Rank shows where current IV sits between the lowest and highest IV readings during a chosen lookback period, commonly the previous 52 weeks.
IV Rank Formula
IV Rank = [(Current IV – Period Low) ÷ (Period High – Period Low)] × 100
An IV Rank of:
- 0 means current IV is at the period low.
- 50 means current IV is halfway between the period low and high.
- 100 means current IV is at the period high.
IV Rank uses only three values:
- Current IV
- The lowest IV
- The highest IV
It does not consider whether IV spent one day or one hundred days near a particular level. This makes IV Rank easy to understand, but it also makes the metric highly sensitive to extreme values.
One unusually large volatility spike can set the 52-week high and affect the calculation for months.
Suggested Read: Supertrend Indicator’s 2 Core Components & the Powerful Setting Behind Clearer Signals
What Is IV Percentile in Options Trading?
IV Percentile measures the percentage of historical observations during which IV was below the current reading.
IV Percentile Formula
IV Percentile = (Observations below current IV ÷ Total observations) × 100
An IV Percentile of:
- 20 means current IV is above roughly 20% of the observations.
- 70 means current IV is above roughly 70% of the observations.
- 90 means current IV is above roughly 90% of the observations.
IV Percentile uses the complete set of observations rather than only the highest and lowest values.
A large one-day spike still affects the calculation, but it counts as one observation. It does not become the upper boundary against which every other reading is measured.
A simple way to remember the difference is:
IV Rank is a ruler. IV Percentile is a headcount.
Suggested Read: Why Expiry Day Is the Most Misunderstood Session in F&O, and #1 Rule To Change Your Results
IV Rank vs IV Percentile: Key Differences
| Factor | IV Rank | IV Percentile |
| Main question | Where is current IV inside the historical range? | How often was historical IV below today’s level? |
| Data used | Current IV, period low and period high | All observations in the lookback period |
| Sensitivity to one extreme spike | High | Comparatively lower |
| Shows distance between values | Yes | No |
| Shows historical frequency | No | Yes |
| Common lookback period | 52 weeks | 52 weeks |
IV Rank tells you how far current IV has travelled from the low towards the high.
IV Percentile tells you how unusual the current reading has been in terms of frequency.
Neither provides the complete picture by itself.
Why IV Rank and IV Percentile Give Different Readings
Consider the following historical IV data:
- 52-week IV low: 18%
- 52-week IV high: 60%
- Current IV: 30%
The IV Rank would be:
[(30 – 18) ÷ (60 – 18)] × 100 = 28.6
Current IV is only 28.6% of the way from the annual low to the annual high. Based only on IV Rank, the reading looks fairly low.
Now assume that 220 of the previous 252 observations were below 30%.
The IV Percentile would be:
(220 ÷ 252) × 100 = 87.3
Current IV is therefore higher than approximately 87.3% of the historical observations.
Both results are mathematically correct.
The likely reason is that the 60% high was an extreme observation. It stretched the range used by IV Rank, making the current 30% reading look low.
IV Percentile was less affected because the 60% reading counted as only one observation among the complete set.
The reverse gap is also possible. IV Rank may be high while IV Percentile is only moderate if IV has spent many days near the top of a narrow range.
A wide gap between the two numbers is not noise. It is a reason to inspect the historical IV chart.
Suggested Read: How to Trade an Iron Condor on Nifty in 2026: The Exact Conditions, Strikes, and Exit Rules
How IV Rank and IV Percentile Relate to Options Strategies
IV Rank and IV Percentile do not tell traders which strategy to choose. They only show whether current implied volatility is low, high or unusual compared with its own history.
When IV Rank and IV Percentile Are Both Low
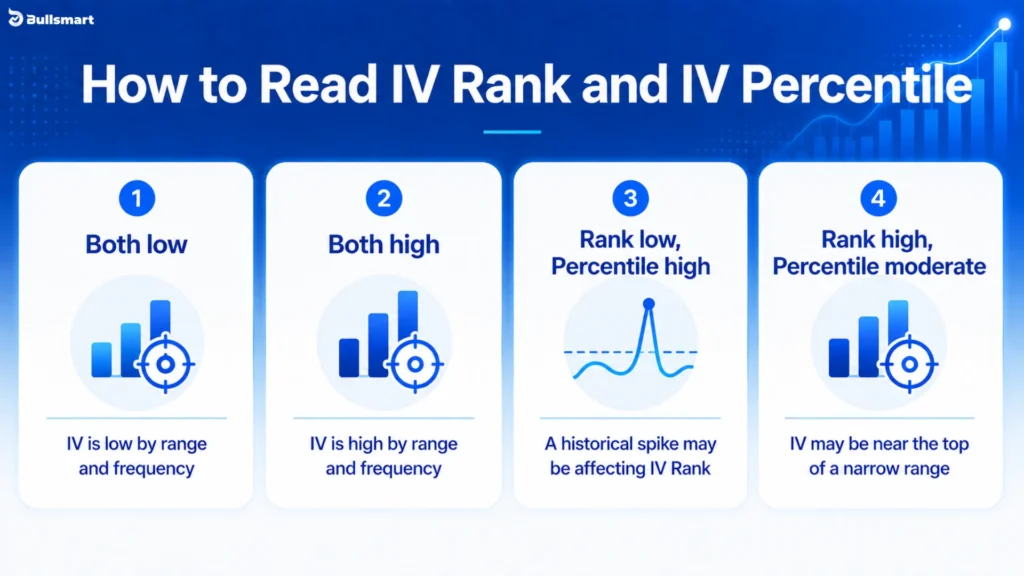
This generally means current IV is near the lower end of its historical range and below most past readings.
Option premiums may also be relatively lower, but this does not mean they are automatically cheap. IV can remain low, fall further or rise only after a long period.
The final outcome will still depend on:
- How much the underlying moves
- How quickly the move happens
- How much time remains until expiry
- How IV changes after the position is created
When IV Rank and IV Percentile Are Both High
This generally means current IV is near the upper end of its range and above most historical readings.
Option premiums may be relatively higher because the market is expecting greater movement or uncertainty.
However, high IV does not mean it must fall. It can remain elevated or rise further. A larger premium may simply reflect a larger expected move and greater risk.
When IV Rank Is Low but IV Percentile Is High
This difference may occur when one unusually large volatility spike has set the 52-week high.
Because IV Rank compares current IV with that extreme high, the current reading may appear low. However, IV Percentile may show that current IV is still above most normal historical readings.
In this situation, a low IV rank alone should not be treated as proof that option premiums are low.
When IV Rank Is High but IV Percentile Is Moderate
This can happen when the historical IV range is narrow or when IV has remained near its upper levels for many days.
Current IV may be close to the 52-week high, but similar readings may not be rare.
The reading is high within the range, but not necessarily unusual compared with the full history.
When Different Expiries Are Involved
Options with different expiry dates can carry different IV levels.
A single IV Rank or IV Percentile reading may therefore not represent every contract accurately. It is also important to compare how volatility changes across expiries and how time decay affects each position.
The key point is simple: IV Rank and IV Percentile provide historical context. They do not select, approve or recommend an options strategy.
How to Use IV Rank: A Six-Step Framework
1. Verify the IV Metric
Check whether the platform is using the standard definitions of IV Rank and IV Percentile.
Also confirm the lookback period. Although one year is common, some platforms allow users to select a different historical period.
2. Check How the IV Series Is Built
A platform may calculate its headline IV using:
- At-the-money options
- A weighted mix of calls and puts
- A specific expiry
- A constant-maturity volatility series
- The broader volatility surface
- A proprietary model
This matters because two platforms can display different values for the same underlying if they use different inputs or models.
3. Compare Rank and Percentile
Similar readings generally tell a consistent story.
A large gap may point to:
- An extreme historical observation
- A narrow IV range
- Volatility clustering
- A different calculation methodology
The gap should lead to more analysis, not an automatic strategy choice.
4. Check the IV Trend
IV Rank and IV Percentile show where IV sits within history. They do not show whether IV is currently rising or falling.
An IV Percentile of 80 can appear while IV is surging. It can also appear after IV has started falling from a much larger spike.
The same percentile can therefore exist during two very different volatility trends.
5. Review Events, Skew and Term Structure
Known events can lift IV in one particular expiry.
Skew can cause downside puts to carry a different IV from upside calls with the same expiry. Term structure can cause near-dated IV to trade above or below longer-dated IV.
A single summary number can hide all these differences.
6. Match Volatility With the Full Risk Profile
Before evaluating a strategy, check:
- Directional view
- Expected size of movement
- Time to expiry
- Delta, theta and vega
- Maximum profit and maximum loss
- Break-even points
- Liquidity and bid-ask spread
- Margin requirements
- Exercise, assignment and settlement risks
IV context is one input. The position’s total risk is the decision.

Does High IV Mean Options Are Expensive?
Not always.
A high IV Rank or IV Percentile only tells us that current implied volatility is high compared with its recent history. It does not automatically mean the option is overpriced.
There may be a genuine reason for the higher IV, such as:
- Financial results
- A policy announcement
- An election
- Another event that could cause a large market move
Higher IV usually means the market is expecting more uncertainty. That expectation may affect some expiries more than others.
The real test comes later. After the option is priced, did the underlying move more or less than the market expected?
This is why traders often compare:
- The volatility expected by option prices
- The volatility that actually happened afterward
The difference between the two is known as the volatility risk premium.
So, high IV means option premiums are high relative to history. It does not necessarily mean they are unfairly priced. Historical comparison gives context, but it does not reveal the option’s true value on its own.
Common IV Rank and IV Percentile Mistakes
Avoid these common shortcuts:
- Treating IV Rank and IV Percentile as interchangeable.
- Assuming high IV must fall soon.
- Assuming low IV must rise soon.
- Using one fixed threshold for every stock and index.
- Ignoring an extreme spike in the lookback period.
- Comparing platforms without checking their methodology.
- Treating one headline IV as the IV of every strike and expiry.
- Ignoring volatility skew, term structure and scheduled events.
- Using IV as a bullish or bearish signal.
- Selling premium only because the credit looks large.
- Ignoring liquidity, slippage, margin and settlement risk.
- Forgetting that relative IV can remain high or low for an extended period.
The biggest mistake is giving either number more authority than it has.
These metrics organise information. They do not remove uncertainty. Derivatives can also create significant risk because the amount paid or deposited may be small compared with the total exposure to the underlying market.
India VIX vs Implied Volatility: What Is the Difference?
| Factor | India VIX | Implied Volatility |
| What it measures | Expected volatility in the NIFTY 50 | Expected volatility of a specific option contract |
| Based on | NIFTY option prices | The market price of an individual option |
| Time period | Expected volatility over the next 30 calendar days | Depends on the option’s expiry |
| Expressed as | An annualised percentage | An annualised percentage |
| Scope | Broad view of expected NIFTY volatility | Can differ across strikes and expiries |
| Same as IV Rank or IV Percentile? | No | No |
| Can Rank and Percentile be calculated from it? | Yes, using historical India VIX readings | Yes, using the selected historical IV series |
Thus, India VIX measures expected volatility in the broader NIFTY market, while IV Rank and IV Percentile show where a current volatility reading stands compared with its own history.
Conclusion: How to Read IV Rank and IV Percentile Together
IV Rank and IV Percentile solve different problems.
IV Rank measures distance. It shows where current IV sits between the selected period’s lowest and highest values.
IV Percentile measures frequency. It shows how often historical IV was below the current reading.
When both are low, current IV is low by both range and frequency. When both are high, it is elevated by both measures. When the two disagree, the gap often points towards an outlier, a narrow range or a clustered volatility distribution.
That disagreement is not a reason to choose one metric and discard the other. It is the reason to use both.
The next step is broader analysis. Check how the platform calculates IV, whether IV is rising or falling, which events are approaching, how volatility differs across strikes and expiries, and how the proposed position responds to price, time and volatility.
The best use of IV Rank and IV Percentile is not to produce a quick “buy” or “sell” answer. It is to prevent a quick but incomplete conclusion about whether option premiums are historically low, high or somewhere in between.
Disclaimer: This article is for educational purposes only. Options and other derivatives involve risk and may not be suitable for every investor. The content does not constitute investment advice or a recommendation to buy, sell or use any security or strategy. Investments in the securities market are subject to market risks. Read all the related documents carefully before investing.
FAQs
How does IV change in options?
IV changes as option prices and market expectations change. Increased demand, major events or expectations of larger price movement can raise IV. Reduced uncertainty or lower demand can bring it down, even without a major move in the underlying.
Is higher IV better for options?
Higher IV is not automatically better. It generally increases option premiums and expected movement, but its impact depends on the position’s volatility exposure, price movement, time to expiry and other risks.
Is 50% IV bad for options?
A 50% IV reading is not automatically bad. It reflects annualised expected variability, but its meaning depends on the underlying’s usual volatility, the option’s expiry, upcoming events and comparable historical IV levels.
Is 60% IV high?
A 60% IV reading may be high for a normally stable underlying but ordinary for a highly volatile one. It should be viewed against the underlying’s own history, current events, strike and expiry.