
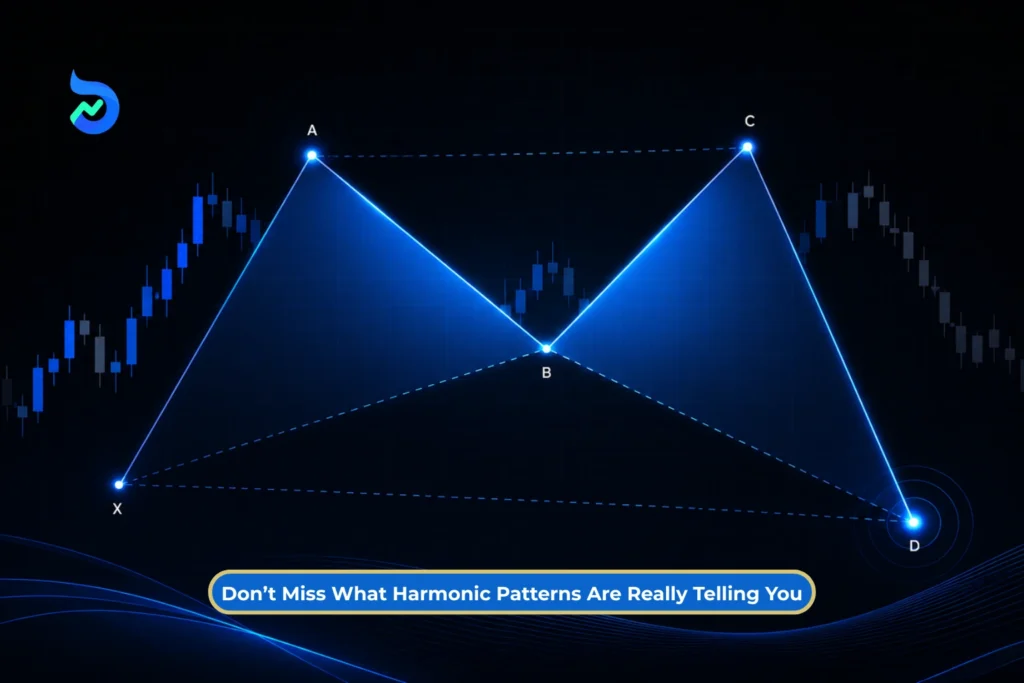
Harmonic patterns can sound more complicated than they really are. At the most basic level, they are simply shapes that form on a price chart when the market moves up and down in a certain way.
To study these moves, analysts mark five points on the chart and name them X, A, B, C and D. They then measure the distance between these points using Fibonacci ratios such as 0.618, 0.786 and 1.272. If the measurements match a known pattern, it may be identified as a Gartley, Butterfly or another harmonic pattern.
The important thing is that these patterns do not tell you exactly what the market will do next. They only show that price has moved in a certain proportion.
The Gartley and Butterfly are two of the best-known harmonic patterns, but they are not the same. The biggest difference is where the final point, D, forms.
In this blog, we will break both patterns down in simple terms and explain what they are actually showing on the chart.
What Are Harmonic Patterns?
A harmonic pattern is a price-chart pattern in which a series of price moves are measured using specific Fibonacci ratios.
Now, the simple part. Price keeps moving up and down on a chart. Harmonic analysis measures those moves to see how one swing compares with another.
The idea is simple: compare each price move with the previous one using Fibonacci ratios. If the shape and measurements match a known structure, it may be identified as a Gartley, Butterfly, Bat or Crab.
So, a harmonic pattern is not just an M or W shape. The Fibonacci measurements also need to match.
What are Points in Harmonic Patterns?
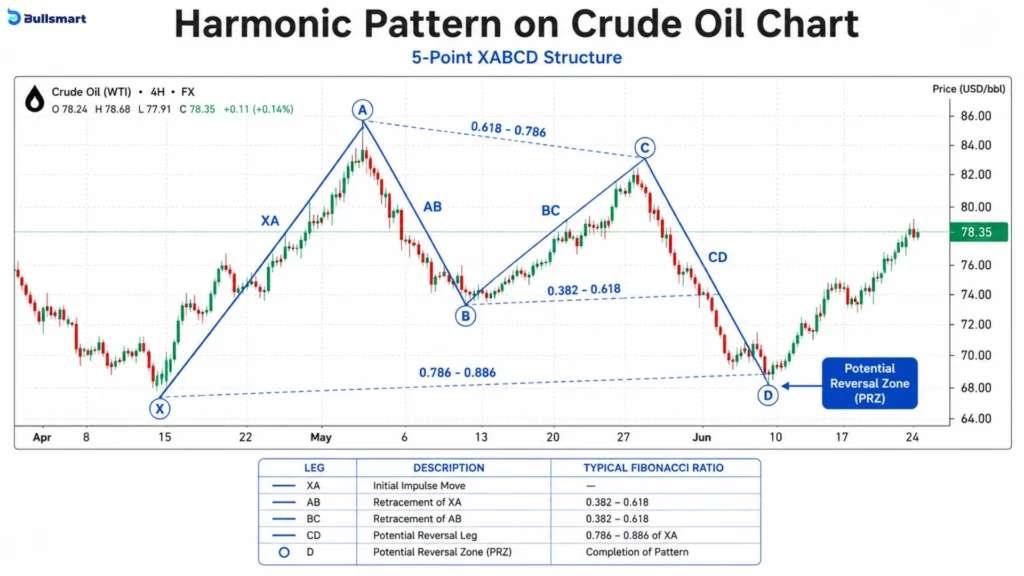
In a harmonic pattern, points are the important turning points on the price chart where the direction of price changes.
Most harmonic patterns use five points: X, A, B, C and D
Each point marks the start or end of a price swing.
- X: Starting point of the pattern
- A: End of the first major price move
- B: First pullback from A
- C: Next move in the opposite direction
- D: Final point where the harmonic pattern completes
These points create four price legs: XA, AB, BC and CD
The distances between these points are then measured using Fibonacci ratios. That is how analysts check whether the structure matches a Gartley, Butterfly, Bat, Crab or another harmonic pattern.
In simple terms, the points are the key highs and lows used to build and measure the pattern.
Suggested Read: Can the 100-Year-Old Gann Square of 9 Really Map Nifty Levels With Surprising Accuracy?
What Are the Main Types of Harmonic Patterns?
There are several harmonic patterns, but four of the most common five-point XABCD patterns are Gartley, Butterfly, Bat and Crab. Each uses the same basic XABCD structure but has different Fibonacci measurements.
1. Gartley Pattern
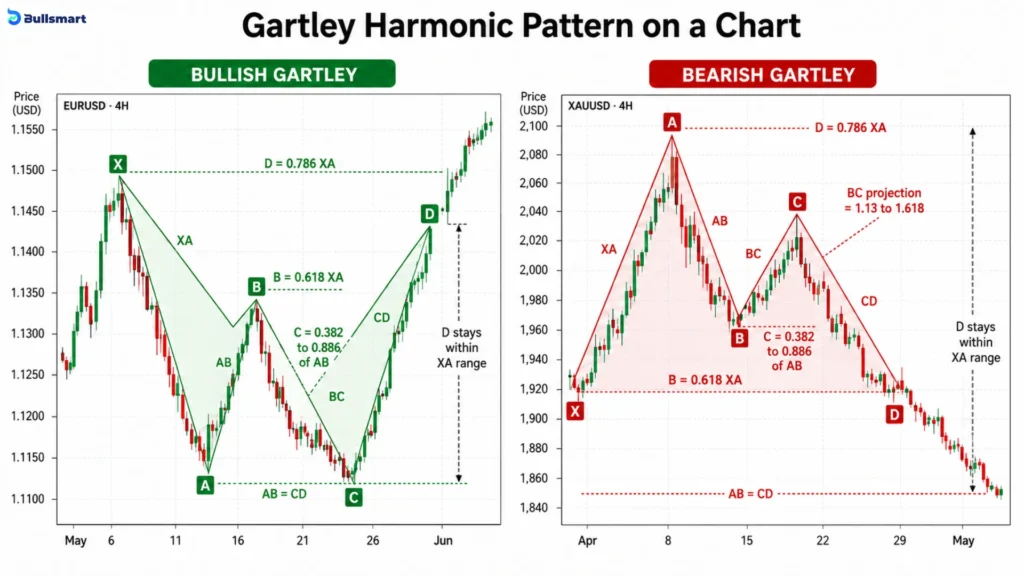
A Gartley pattern is a harmonic pattern in which price makes a strong move, pulls back deeply, and completes before crossing the original X point.
In the commonly used modern structure, the B point is around 0.618 of XA, while D completes around 0.786 of XA.
How Does the Gartley Pattern Work?
It starts with the first major price move from X to A.
Price then moves back to B, changes direction towards C, and finally moves towards D.
The important part is that D stays inside the original XA range. This tells us that price has retraced a large part of the first move, but has not completely erased it.
Other measurements, such as AB=CD and the BC projection, are also checked around D to see whether the complete Gartley structure fits.
Example
Suppose XA moves from Rs. 100 to Rs. 200.
The total XA move is Rs. 100.
A 0.618 retracement would place B around Rs. 138.20.
If the final D point forms near the 0.786 retracement of XA, it would be around Rs. 121.40.
Since D remains above the original Rs. 100 X point, the structure is still inside the original XA range.
That is the basic idea behind a Gartley.
2. Butterfly Pattern
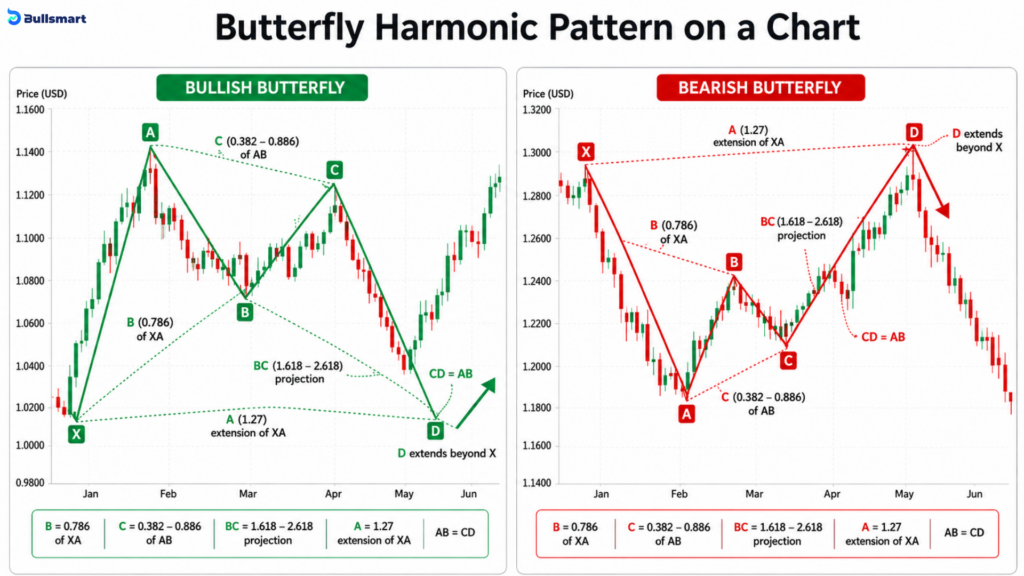
A Butterfly pattern is a harmonic pattern in which the final D point moves beyond the original X point.
In the commonly used modern structure, B forms around 0.786 of XA, while D usually reaches approximately a 1.27 extension of XA.
How Does the Butterfly Pattern Work?
Like the Gartley, it begins with an XA move followed by swings through B and C.
The big difference appears during the final CD move.
Instead of stopping before X, price continues past X.
This means the Butterfly is measuring an extension beyond the original price extreme rather than only a deep retracement.
Several measurements, including the XA extension, AB=CD relationship and BC projection, are checked around D.
Example
Suppose XA moves from Rs. 100 to Rs. 200.
A 0.786 retracement would place B around Rs. 121.40.
Later, the final CD move continues beyond X.
If D reaches approximately a 1.27 extension of XA, it would form below the original Rs. 100 level in a bullish Butterfly structure.
The key point is simple:
Gartley stops before X. Butterfly moves beyond X.
3. Bat Pattern
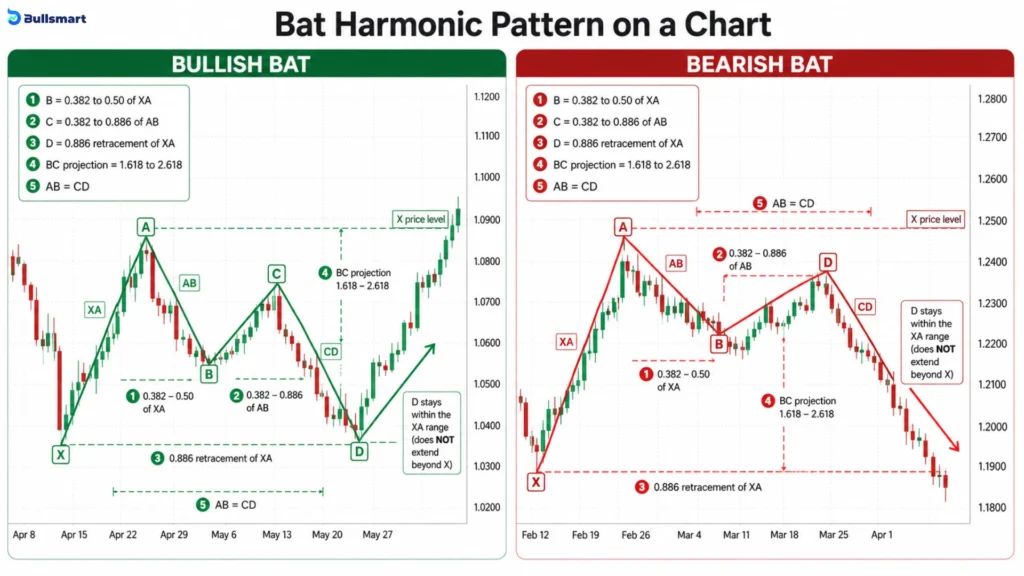
A Bat pattern is a harmonic pattern in which the first retracement is usually smaller than in a Gartley, while the final D point forms close to a deep retracement of XA.
In the commonly used Bat structure, B usually retraces around 0.382 to 0.50 of XA, while D completes near the 0.886 retracement of XA.
How Does the Bat Pattern Work?
The pattern starts with XA.
Price then retraces only a moderate part of that first move to create B. This is one of the easiest ways to separate a Bat from a Gartley.
After B and C form, the CD leg moves much deeper towards X.
However, D still remains inside the original XA range.
So, compared with the Gartley, the Bat generally has a smaller B retracement but a deeper D retracement.
Example
Suppose XA moves from Rs. 100 to Rs. 200.
If B retraces 50% of XA, B would form around Rs. 150.
Later, if D reaches the 0.886 retracement of XA, it would form around Rs. 111.40.
D is now very close to X, but it still has not crossed the original Rs. 100 level.
That deep D retracement is one of the main features of the Bat pattern.
4. Crab Pattern
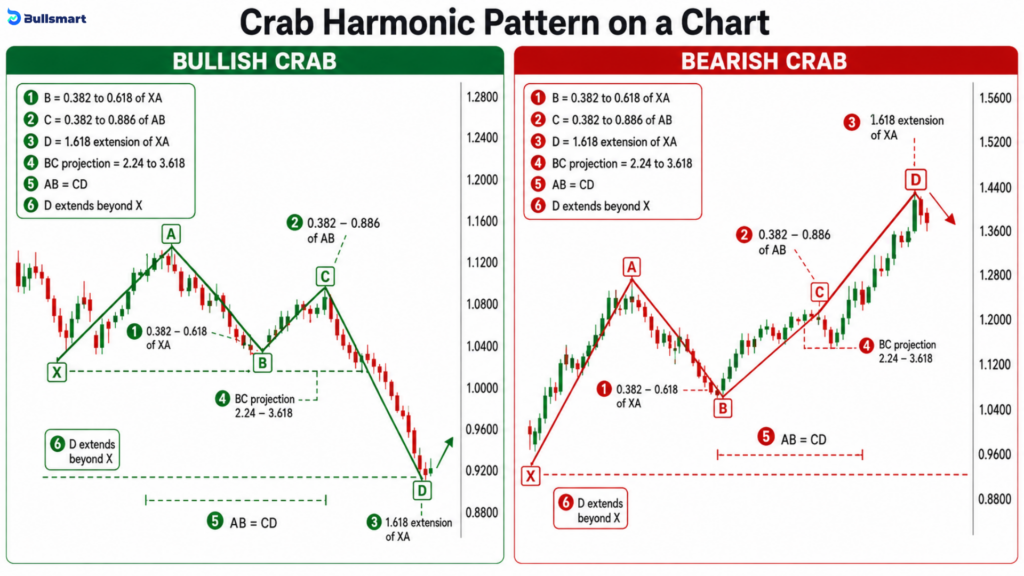
A Crab pattern is a harmonic pattern in which the final D point extends sharply beyond X.
It is known for having one of the larger final extensions among common harmonic patterns.
In the standard Crab structure, D is commonly associated with approximately a 1.618 extension of XA.
How Does the Crab Pattern Work?
The pattern begins with the usual XA, AB and BC movements.
But the final CD leg is much larger.
Instead of stopping inside XA, price pushes well past X before reaching the area where the Crab completes.
This is what separates it from patterns such as the Gartley and Bat.
The Crab therefore represents a much stronger extension of the original price structure.
Example
Suppose XA moves from Rs. 100 to Rs. 200.
The original move is Rs. 100.
If the final D point reaches a 1.618 extension of XA in a bullish Crab structure, price would move significantly below the original Rs. 100 X point before the pattern completes.
So while the Gartley and Bat remain inside X, the Crab moves clearly beyond it.
Suggested Read: Supertrend Indicator’s 2 Core Components & the Powerful Setting Behind Clearer Signals
Gartley Pattern vs. Butterfly Pattern vs. Bat Pattern vs. Crab Pattern: Compared
| Feature | Gartley | Butterfly | Bat | Crab |
|---|---|---|---|---|
| Main structure | XABCD | XABCD | XABCD | XABCD |
| B point | Around 0.618 of XA | Around 0.786 of XA | Usually 0.382 to 0.50 of XA | Around 0.382 to 0.618 of XA |
| D point | Around 0.786 of XA | Around 1.27 extension of XA | Around 0.886 of XA | Around 1.618 extension of XA |
| Does D cross X? | No | Yes | No | Yes |
| Main price behaviour | Deep retracement | Extension beyond X | Very deep retracement | Strong extension beyond X |
| Why is it used? | To study whether a deep correction is completing before price reaches X | To study a price move that has already extended beyond X | To study a deeper retest that comes very close to X without crossing it | To study a much larger extension beyond X |
| Main advantage | Clear 0.618 B and 0.786 D measurements make the ideal structure well defined | D moving beyond X makes it easier to separate from retracement patterns | The shallower B and deep 0.886 D help distinguish it from Gartley | The 1.618 XA extension makes the completion structure highly distinct |
| Main limitation | Can be confused with a Bat if B and D are not measured properly | Can be confused with a Crab because both extend beyond X | Can look similar to Gartley since both complete inside X | Can look similar to Butterfly if you only check whether D crossed X |
| What makes it different? | D stays inside XA after a deep correction | D moves beyond X | B retraces less, while D comes much closer to X | D extends much further beyond X |
| Simple way to remember it | Deep pullback | Extension | Deeper pullback | Bigger extension |
Why Are Harmonic Patterns Used?
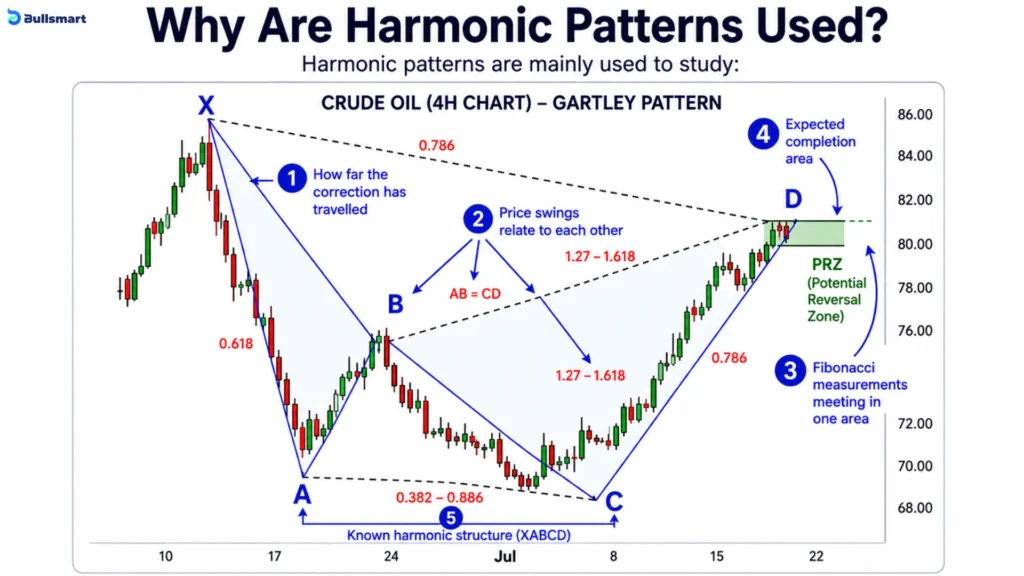
- Measure Price Moves: To see how far a price swing has travelled.
- Compare Swings: To compare one price move with the previous one.
- Check Fibonacci Ratios: To see whether key Fibonacci measurements are lining up.
- Find Pattern Completion: To identify where a harmonic structure may finish forming.
- Identify the Pattern Type: To tell whether the structure is a Gartley, Butterfly, Bat, Crab or another pattern.
- Study Possible Reversal Areas: To locate areas where price may react, without assuming a reversal is guaranteed.
What Does Pattern Completion Mean?
A harmonic pattern is complete when price reaches point D and the required measurements line up.
For example, in a Gartley pattern, B is usually around 0.618 of XA and D around 0.786 of XA. Other measurements are also checked near D.
But remember that the pattern completion does not mean price will reverse.
It only means the pattern has finished forming.
After point D, price may:
- Reverse
- Move sideways
- Continue in the same direction
So, think of point D as the end of the pattern, not a guaranteed reversal point.
Suggested Read: Ichimoku Cloud Trading Strategy & 7 Crucial Signals for Indian Markets
What Are Fibonacci Ratios?
Fibonacci ratios are fixed numbers used to measure how much price has moved back or moved beyond an earlier price move.
For example, if price makes a move from X to A, Fibonacci ratios help measure how much of that move is covered by the next swing.
Some commonly used ratios in harmonic patterns are:
- 0.618, or 61.8%
- 0.786, or 78.6%
- 1.272, or 127.2%
- 1.618, or 161.8%
A ratio below 1, such as 0.618, usually measures a move that stays within the earlier price range. A ratio above 1, such as 1.272, measures a move that goes beyond it.
Why Are Fibonacci Ratios Used in Harmonic Patterns?
Harmonic patterns are identified by how far each price swing moves compared with another swing.
Fibonacci ratios give fixed measurements for making that comparison.
For example:
- In a Gartley, B usually forms near 61.8% of XA.
- In a Butterfly, B usually forms near 78.6% of XA.
- The final D point is also measured using specific ratios.
So, the ratios help answer one basic question: Do these price moves match the measurements required for a known harmonic pattern?
They help identify the pattern. They do not predict what price will definitely do next.
What Is a Potential Reversal Zone in Harmonic Patterns?
A Potential Reversal Zone (PRZ) is the area where a harmonic pattern is expected to complete, usually near point D.
It is not based on just one level. A PRZ forms when multiple measurements point to the same price area, such as XA, AB=CD and BC projections.
Simply put: When several harmonic measurements meet around the same price, that area becomes the PRZ.
For example, in a Gartley pattern, the 0.786 XA level is checked along with AB=CD and BC measurements near point D.
A PRZ does not guarantee a reversal. It only shows an area where a reversal may potentially happen.
Bullish vs Bearish Harmonic Patterns
| Point | Bullish Harmonic Pattern | Bearish Harmonic Pattern |
| Final CD move | Moves downward towards D | Moves upward towards D |
| Point D forms | Near the lower part of the pattern | Near the upper part of the pattern |
| What it indicates | Possible upward reversal area | Possible downward reversal area |
| Does it guarantee a reversal? | No | No |
| Easy way to remember | Price moves down to D | Price moves up to D |
The same Fibonacci rules apply to both. The main difference is the direction of the pattern.
Also, the measurements matter more than whether the chart simply looks like an M or W.
How to Read a Harmonic Pattern Step by Step
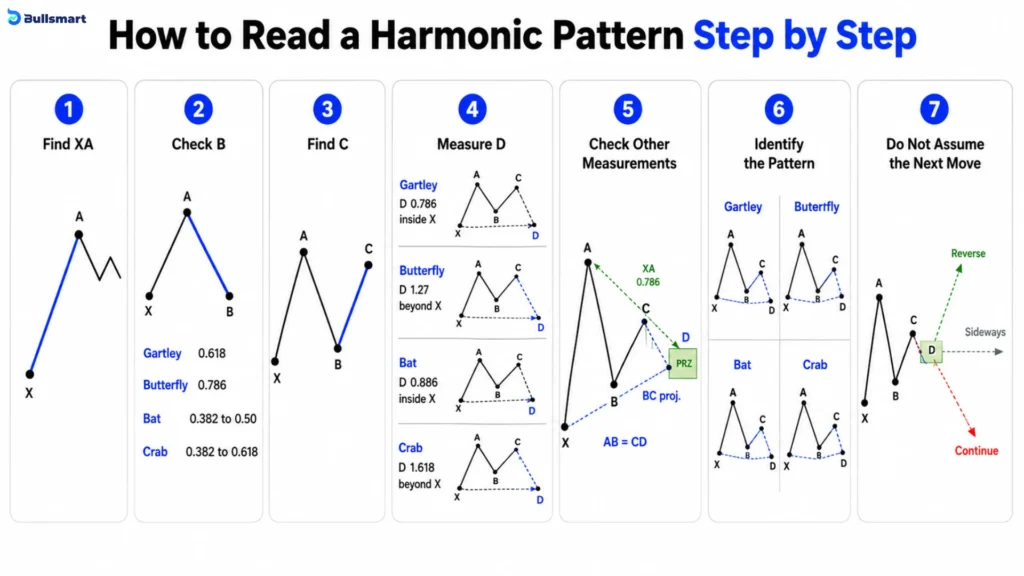
Once you understand X, A, B, C and D, reading a harmonic pattern becomes much easier.
Step 1: Find the XA Move
Start with the first major price move from X to A.
XA acts as one of the main reference points for the rest of the pattern.
Step 2: Check Where B Forms
Next, measure how far price has moved back from A to B.
The B point is very important because different harmonic patterns require different B measurements.
For example:
- Gartley: B is around 0.618 of XA
- Butterfly: B is around 0.786 of XA
- Bat: B is below 0.618, with 0.50 or 0.382 preferred in the standard framework
- Crab: B generally falls around 0.382 to 0.618 of XA
So, B provides an early clue about which pattern may be forming.
Step 3: Find C
After B, price changes direction again and forms C.
This creates the BC leg.
C is important because the BC move is later used to calculate one of the measurements around D.
Step 4: Measure D
Now check where the final CD move ends.
This is where the patterns become easier to tell apart.
For example:
- Gartley D is around 0.786 of XA and stays before X.
- Butterfly D moves beyond X, with 1.27 of XA being a key measurement.
- Bat D stays before X around 0.886 of XA.
- Crab D moves beyond X towards 1.618 of XA.
Step 5: Check the Other Measurements
D should not be judged using only one Fibonacci ratio.
Other measurements, such as the AB=CD relationship and BC projection, can also be checked to see whether they come together around the same area. This convergence is a central part of defining the PRZ in the harmonic framework.
Step 6: Identify the Pattern
Once the points and ratios have been measured, compare them with the rules of the different harmonic patterns.
If the measurements fit the Gartley rules, it may be a Gartley. If they fit the Butterfly measurements, it may be a Butterfly.
The same applies to Bat, Crab and other structures.
Step 7: Do Not Assume the Next Move
Even if every measurement matches, the pattern only tells you that the structure has completed.
It does not tell you with certainty what price will do next.
Common Mistakes Traders Make with Harmonic Patterns
Harmonic patterns can be useful for measuring price swings, but they are also easy to misread. Here are some common mistakes traders make:
- Looking only at the shape: An M or W shape is not enough. The Fibonacci measurements also need to match the pattern rules.
- Choosing the wrong points: If X, A, B, C or D are marked incorrectly, all the later measurements can also become wrong.
- Ignoring Point B: The B point is important because it helps separate one harmonic pattern from another. For example, Gartley and Butterfly use different B-point measurements.
- Forcing a pattern to fit: Not every price movement forms a harmonic pattern. Changing the points just to make the ratios match can lead to a false setup.
- Mixing different pattern rules: Gartley, Butterfly, Bat and Crab use different Fibonacci measurements. Using ratios from different patterns together can create confusion.
- Treating D as a guaranteed reversal: Point D only shows where the pattern completes. Price can still continue moving in the same direction.
- Using very wide ratio ranges: If too much variation is allowed, almost any price movement can start to look like a harmonic pattern.
- Judging patterns only in hindsight: Harmonic patterns often look much clearer after the full price move is already visible.
- Ignoring failed patterns: Looking only at successful examples can make harmonic patterns seem more accurate than they actually are.
The main rule is simple: follow the same measurements consistently and treat the pattern as a way to study price structure, not as a guaranteed signal.
Limitations of Harmonic Patterns
Harmonic patterns provide a structured way to measure price swings, but they also have some important limitations.
1. Choosing the Points Can Be Subjective
One person may select a particular high as X or A, while someone else may select a slightly different one.
That matters because changing one point changes the measurements that follow.
This is not a problem limited to harmonic patterns. Academic research into technical chart patterns has identified subjectivity in recognising geometric shapes as one of the broader difficulties in testing technical analysis objectively.
2. Price May Not Match a Ratio Perfectly
A chart will not always stop exactly at 0.618, 0.786 or another Fibonacci measurement.
Some harmonic frameworks therefore allow limited tolerance around certain measurements. For example, Carney’s published Gartley framework describes a small tolerance around the 0.618 B-point measurement.
The problem is that if the acceptable range becomes too wide, many ordinary price movements can start to look like harmonic patterns.
3. Different Patterns Can Look Similar
Gartley, Bat, Butterfly and Crab can all create similar-looking five-point structures.
That is why the ratios matter.
The visual shape alone is not enough to tell them apart.
4. Patterns Look Clearer in Hindsight
Once the whole price move is visible, finding X, A, B, C and D becomes easier.
When the pattern is still developing, D may not even exist yet.
This makes historical charts easier to interpret than charts that are still forming.
5. Pattern Completion Does Not Guarantee a Reversal
This is the most important limitation.
A price structure can satisfy the pattern measurements and still fail to produce the expected reversal.
The harmonic framework itself separates the identification of a completed pattern from the later assessment of price behaviour around the PRZ.
Do Harmonic Patterns Actually Work?
This is where things get interesting.
You may come across claims like “Gartley is 70% accurate” or “Butterfly patterns have a high success rate.” But without knowing how those numbers were calculated, they do not tell us much.
Instead of focusing on a fixed accuracy number, check a few things before using a harmonic pattern:
- Are the Fibonacci ratios close to the required levels?
- Do multiple measurements come together around point D?
- Is the pattern clearly formed, or are the points being forced to fit?
- What market and timeframe are you looking at?
- Has price actually reacted around the PRZ, or has it simply reached it?
Most importantly, remember that pattern completion is not the same as confirmation.
Harmonic patterns can help organise and measure price movement, but they cannot guarantee what price will do next.
Guess the Harmonic Pattern
Read the chart, inspect the marked Fibonacci measurements on the chart itself, and choose the correct pattern.
Which harmonic pattern is this?
How to read it
Start with point B, then compare D with X. The chart itself marks the key retracement or extension values so you can identify the pattern from the visual clues.
Quiz complete
Your final score
Educational simulator only. Harmonic patterns and Fibonacci measurements do not guarantee a reversal or future price movement.
Bottom Line
Harmonic patterns may look complicated at first, but once you break them down, the idea is fairly simple. They are basically a way to measure how different price swings relate to each other using Fibonacci ratios.
The Gartley, Butterfly, Bat and Crab all use the same XABCD structure, but their key ratios and the position of point D are different. That is what helps separate one pattern from another.
The most important thing to remember is that point D marks where the pattern completes. It does not mean price will definitely reverse from there. Price can reverse, move sideways or simply continue in the same direction.
So, harmonic patterns are best treated as a structured way to study price movement, not as a shortcut to predict the market. Focus on whether the points are marked correctly, whether the Fibonacci measurements match, and whether the pattern is being identified without forcing it.
If there is one takeaway from this entire blog, it is this: harmonic patterns can show you how price has moved, but they cannot tell you with certainty what price will do next.
Disclaimer: Investments in securities market are subject to market risks, read all the related documents carefully before investing. This article is for educational and informational purposes only and should not be considered investment or trading advice. Harmonic patterns, Fibonacci ratios and other technical analysis tools do not guarantee future price movements or returns. Always conduct your own research and consider your risk tolerance before making any investment or trading decision.
FAQs
What is the Butterfly harmonic pattern?
The Butterfly is a five-point harmonic pattern marked X, A, B, C and D. Its main feature is that the final D point moves beyond X. In the commonly used structure, B forms near 78.6% of XA, while D extends to around 127.2% of XA. It is used to identify a potential pattern-completion area.
Does harmonic trading really work?
Harmonic patterns can help traders measure price swings and identify areas where a pattern may complete. However, there is no scientifically established success rate that applies to every harmonic pattern. Results can vary depending on the market, timeframe, Fibonacci tolerances and how the points are selected. Pattern completion also does not guarantee a price reversal.
What is the most powerful pattern in trading?
There is no single trading pattern that can be called the most powerful or consistently reliable across all markets and timeframes. Different patterns work differently depending on market conditions and how they are identified. A chart pattern should therefore be treated as one way of studying price behaviour, rather than as a guaranteed signal for future price movement.
Which harmonic pattern is the best?
There is no harmonic pattern that is proven to be the best in every market or timeframe. Gartley, Butterfly, Bat and Crab patterns use different Fibonacci measurements and represent different price structures. Their usefulness depends on how accurately the pattern is identified and how price behaves around the completion area. None of them guarantees a successful reversal.