
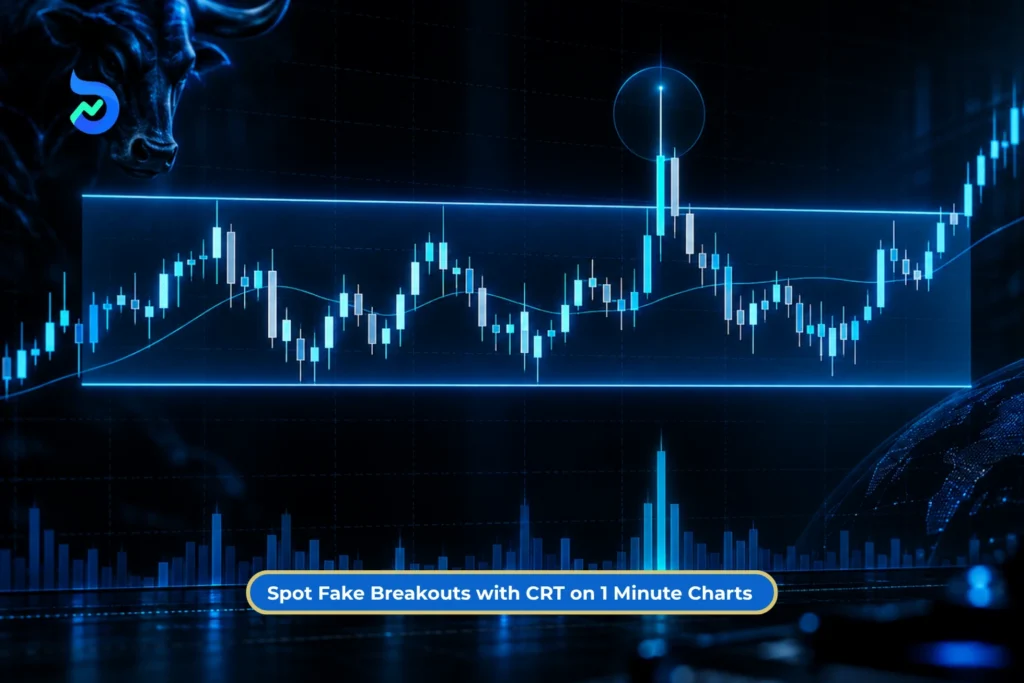
Breakouts attract attention. Failed breakouts raise questions. CRT on 1 minute charts puts those questions at the centre of the discussion.
A price move can look convincing while it is happening and completely different once the candle closes. On a chart that prints a new candle every minute, there is rarely a shortage of movement to interpret. The challenge is deciding which moves deserve attention and which are simply noise.
That is where Candle Range Theory, or CRT, enters the conversation. It has a straightforward premise, but straightforward does not automatically mean easy to trade. Nor does a neat collection of chart screenshots tell you how consistently a setup works.
So, what separates a useful observation from a pattern that only looks obvious afterwards? And can a framework built around candle ranges offer enough structure for such a fast timeframe?
In this blog, we’ll explore how CRT approaches failed breakouts, what traders need to watch for and where its limitations begin. We’ll also look at how to test the setup objectively, because an appealing explanation is only the starting point.
What Is CRT or Candle Range Theory?
Candle Range Theory, or CRT, is a price-action framework that uses a completed candle’s high and low to study how price behaves around that range.
The idea is simple: price moves beyond one end of the range, then closes back inside it. CRT traders commonly describe this as a sweep and reclaim. They may then watch the opposite end of the range as a possible target, although price is not guaranteed to reach it.
Here’s what the common terms mean:
- Range or parent candle: The completed candle used to establish the reference range.
- Candle Range High (CRH): The highest price reached during that candle.
- Candle Range Low (CRL): The lowest price reached during that candle.
- Sweep: Price briefly moves beyond the range high or low.
- Reclaim: Price closes back inside the original range after crossing a boundary.
CRT is used in trading communities rather than defined by an exchange or governed by one standard set of rules. Its terminology and setup conditions can therefore vary between traders.
Suggested Read: 4 Reasons Nifty Fake Breakouts Hit Your Stop-Loss and Reverse
What Does CRT on a 1-Minute Chart Actually Mean?
“1-minute CRT” can describe two different approaches. The difference is which candle sets the range.
1. A 1-Minute Candle Sets the Range
Here, the high and low of a completed 1-minute candle become the reference boundaries.
Traders watch the following 1-minute candles for a move outside those boundaries and a close back inside. Because each candle covers just one minute, there are more potential ranges to track.
2. A Larger Candle Sets the Range
Here, a completed candle from a higher timeframe sets the boundaries. The 1-minute chart is then used to watch price movements around those levels more closely.
The reference range stays the same when you switch to the 1-minute view. You simply see more detail within it.
More Detail Does Not Mean More Accuracy
A 1-minute chart also captures small price movements caused by how trades are executed. Prices can shift between buyers’ bids and sellers’ offers without signalling a meaningful change in direction.
A wick shows that price reached a level. It does not explain why price moved there or tell you what will happen next.
The Core CRT Structure: Range, Sweep and Reclaim
Stage 1: Range
The range is the space between a completed candle’s highest and lowest prices.
Mark those two prices on the chart. The upper line is the Candle Range High (CRH), and the lower line is the Candle Range Low (CRL). These are the boundaries you will watch as price moves.
Stage 2: Sweep
A sweep happens when price crosses outside either of those boundaries.
Price moves above the upper line or below the lower line. At this stage, you only know that price has left the range. You do not yet know whether it will return.
Stage 3: Reclaim
A reclaim happens when price returns to the range and a candle closes inside it.
After the sweep, watch where the candle finishes:
- Closes between the two lines: The range has been reclaimed.
- Closes outside the two lines: There is no reclaim yet.
Returning inside briefly is not enough. The candle must close there. This confirms the reclaim, but it does not guarantee a reversal.
Suggested Read: 3 Powerful CPR Indicator Types for Nifty Intraday Trading: Narrow, Wide & Virgin CPR Explained
Bullish vs Bearish CRT: What Traders Are Actually Looking For
Bullish CRT forms when price moves below the reference candle’s low, then closes back inside its range. Traders watch for a possible move towards the range high.
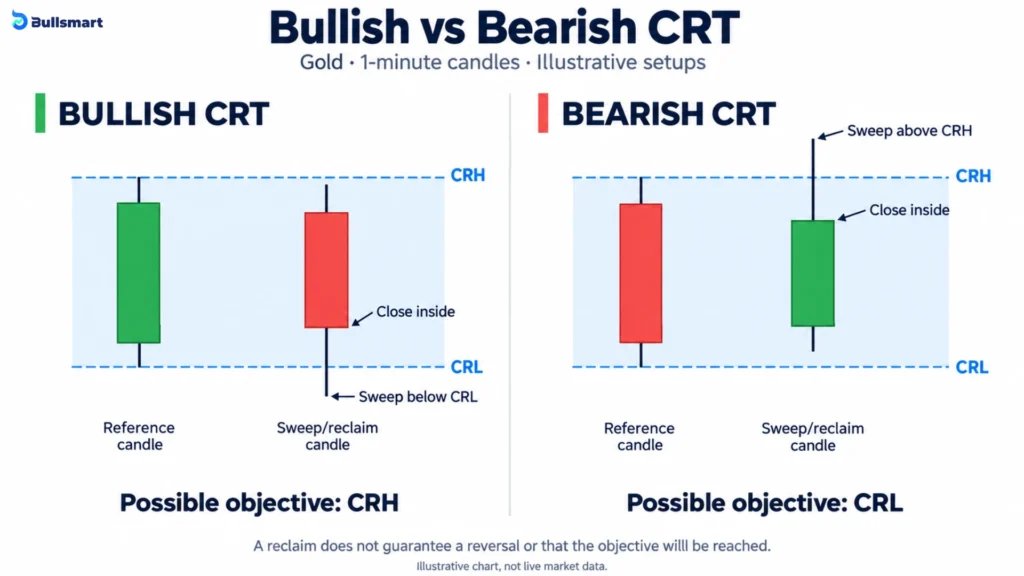
Bearish CRT forms when price moves above the reference candle’s high, then closes back inside its range. Traders watch for a possible move towards the range low.
Suggested Read: Elder’s Triple Screen System: The 3 Timeframe Check Before Every Trade
| CRT Element | Bullish Structure | Bearish Structure |
| Reference range | A completed candle’s high and low | A completed candle’s high and low |
| Initial move | Price falls below the range low (CRL) | Price rises above the range high (CRH) |
| Reclaim | A candle closes back inside the range | A candle closes back inside the range |
| Possible direction after reclaim | Up towards the range high (CRH) | Down towards the range low (CRL) |
| Is that move guaranteed? | No | No |
The distinction is between what has happened and what might happen next. The close confirms that price has returned inside the range. It does not confirm that price will reach the other side.
CRT Sweep vs Fake Breakout vs Real Breakout
CRT and fake breakouts overlap, but they are not identical.
| Price behaviour | Boundary crossed? | Closes back inside? | Holds outside? |
| Intrabar wick-through | Yes | Possibly | Not known yet |
| CRT-style reclaim | Yes | Yes | No |
| Failed breakout | Yes | Usually returns | No |
| Breakout retest | Yes | May revisit level | Eventually |
| Sustained breakout | Yes | No | Yes |
A fake breakout describes price moving beyond a reference level and failing to hold. CRT is a framework that organises one particular form of that behaviour around the high and low of a completed candle.
The key question is therefore not simply whether price crossed the line. It is what price did after crossing it.
Why Can Price Cross a Level and Immediately Return?
Crossing a level and continuing beyond it are different things. Price may briefly break a boundary, then return when buying or selling interest fades.
1. Stop Orders Can Activate During a Brief Move
A stop-loss trigger is the price at which a stop order becomes active.
Once that price is reached or crossed, the order enters the regular order book. Price does not need to stay beyond the level for activation to occur. Execution then depends on the order type and available prices.
A triggered stop does not confirm a sustained breakout.
2. Clustered Stops Can Accelerate Price Movement
Clustered stops are stop-loss orders concentrated around similar price levels.
Research using foreign-exchange order data has found that several stops triggering in succession can contribute to rapid price movements. However, this does not prove that every wick on an Indian index chart is a deliberate “stop hunt”.
Suggested Read: Hottest Candlestick Patterns Thrilling Traders Across the Globe in 2026
3. Buying and Selling Pressure Can Change Quickly
A breakout needs continued buying or selling to maintain its direction. Price may return when:
- The initial burst of buying or selling fades.
- Orders in the opposite direction become stronger.
- Normal volatility or changes between bid and ask prices create brief fluctuations.
Suggested Read: Why Moving Averages Are India’s Most Used Yet Most Misused Trading Tool: 20 EMA, 50 EMA, 50 SMA & 200 SMA
What Can the Candle Tell You?
A candle shows where price traded and where it closed. It cannot reveal who caused the move or whether anyone deliberately targeted stop-loss orders.
How to Read a CRT Setup on a 1-Minute Chart
- Fix the Reference Range: Use a completed reference candle and record its CRH, CRL and total range.
- Wait for a Boundary Interaction: A CRT reclaim cannot exist until price has reached or crossed one side of the reference range.
- Separate the Extreme From the Close: Record the highest or lowest price reached outside the range separately from the closing price. A wick and a close answer different questions.
- Check the Reclaim: For the definition used here, a close back inside satisfies the reclaim condition. A close outside does not.
- Check the Higher Timeframe: A large-looking move on M1 may be only a small part of an M5, M15 or hourly candle. Multi-timeframe context helps show whether the move is significant beyond the smallest chart.
- Separate Invalidation From the Objective: CRT traders commonly use the sweep extreme as an invalidation reference and the opposite range boundary as a possible objective. These are CRT conventions, not scientifically established optimal stop or target levels.
- Include Trading Costs: For scalping, small gross price movements can be materially affected by brokerage, statutory charges, spread and slippage. Trading costs are particularly relevant when assessing frequent short-term trading. Regulatory studies of Indian individual traders have repeatedly shown that transaction costs can materially worsen net trading outcomes.
Try this simulator and let us know in the comments if it helped you understand the concept better 😉
CRT, one candle at a time.
No chart experience needed. We’ll show you what to look at, then let you try.
Ready for more? Explore the full seven-step checklist
You’ve learned the basic pattern. Here is where it fits into the wider reading process.
- Fix the reference range. Use a completed candle. Its highest price is the Candle Range High (CRH); its lowest is the Candle Range Low (CRL). Here: 2,410 minus 2,390 gives a $20-per-ounce range.
- Wait for a boundary interaction. Watch price reach or cross a range line. In this exercise, a sweep requires a move strictly beyond the line; touching alone does not count.
- Separate the extreme from the close. In our reclaim example, price reached 2,385 but closed at 2,398. The low records the furthest move down. The close records where that minute ended.
- Check the reclaim. Here, the same candle must breach one boundary and close strictly between both range lines. Returning inside while the candle is still forming is not enough. CRT definitions can vary.
- Check the higher timeframe. An M5 candle groups five minutes of price movement; M15 groups fifteen. Compare the M1 move with a wider chart before interpreting its significance. This short demonstration does not establish that wider context.
- Separate invalidation from the objective. After the lower-boundary reclaim shown here, CRT traders may use the sweep low of 2,385 as an invalidation reference and the upper line at 2,410 as a possible objective. These conventions are not proven optimal stop or target levels. A reclaim does not guarantee that the objective will be reached. An upper-boundary breach and inside close is the bearish counterpart.
- Include trading costs. Brokerage, applicable charges, spread and slippage can reduce or erase small gross gains. Evaluate net results and avoid counting costs twice if they are already included in execution prices.
Does Candle Range Theory Actually Work?
There is no reliable independent evidence showing a fixed success rate for CRT.
However, you can test clearly defined CRT rules using historical price data. This is called backtesting. You can track:
- Which candle sets the range.
- Which boundary price crosses and how far it moves beyond it.
- Whether the candle closes back inside.
- Whether price reaches the midpoint or opposite boundary.
- How far price moves in each direction and how long it takes.
- How trading costs affect the results.
General trading-loss figures do not measure CRT’s performance.
The FY26 regulatory study cited here found that 87.7% of individual equity derivatives traders lost money, with combined net losses of about ₹91,685 crore.
An earlier study found that 7 out of 10 individual intraday traders in the equity cash segment lost money in FY23.
These figures show that short-term trading is difficult. They do not tell us how many traders used CRT or lost money because of fake breakouts.
| Aspect | Advantage | Limitation |
| Clear reference points | A completed candle gives traders a fixed high and low to watch. | Choosing a different reference candle can change the setup. |
| Reading breakouts | Helps distinguish a boundary crossing from a close back inside the range. | An inside close does not guarantee a reversal. |
| Simple structure | Range, sweep and reclaim provide a clear sequence to follow. | CRT definitions vary, so traders may interpret the same chart differently. |
| Planning a trade | The sweep extreme and opposite boundary provide possible invalidation and objective levels. | These levels are not proven to be the best stop-loss or target placements. |
| Testing the rules | Clearly defined rules can be checked against historical data. | Results depend on the rules, data and costs used. Past results do not guarantee future performance. |
| Use on short timeframes | A 1-minute chart shows price movements in greater detail. | Frequent price fluctuations can make setups harder to interpret, while costs can reduce small gains. |
How to Backtest CRT Without Cherry-Picking Charts
Define the rules before examining results:
- What qualifies as the reference candle?
- Does an equal high or low count as a sweep?
- Must the reclaim occur in the same candle?
- How long does the setup remain valid?
- What counts as reaching the opposite boundary?
- Which trading costs are deducted?
Then record every qualifying setup, not only clean reversals.
Changing the definition after seeing which examples succeeded creates hindsight bias. Removing failed patterns from the sample creates the same problem.
A useful CRT test should be reproducible. Another person applying the same rules to the same data should be able to identify substantially the same events.
Bottom Line
CRT is most useful when it separates three things that are often treated as one: the range, the boundary breach and the close.
Price moving beyond a candle’s high or low proves only that the level was crossed. Whether price remains outside or closes back inside provides additional information about what happened next.
That distinction matters even more on a 1-minute chart because short-term prices contain substantial movement and market-microstructure noise.
CRT can therefore be studied as a structured way to classify failed-breakout behaviour. It should not be treated as proof of institutional manipulation, a guaranteed reversal model or a shortcut to a fixed win rate.
The real test is whether clearly defined CRT rules continue to hold up across complete historical samples after costs.
Disclaimer: This article is for educational and informational purposes only and should not be considered investment or trading advice. Candle Range Theory (CRT) is a price-action framework used by traders and does not guarantee profitable outcomes. Trading and investing in securities and derivatives involve market risk, and past price behaviour does not ensure future results. Readers should conduct their own research, consider transaction costs and risk tolerance, and consult a SEBI-registered investment adviser or other qualified professional where appropriate before making financial decisions. Bullsmart does not guarantee the accuracy or profitability of any trading strategy discussed in this article.
FAQs
What is CRT in trading?
CRT, or Candle Range Theory, uses the high and low of a completed candle as reference boundaries. Traders observe whether price breaches one side of that range and closes back inside it, creating a sweep-and-reclaim structure.
Does CRT work on a 1-minute chart?
CRT rules can be applied or refined on a 1-minute chart, but lower timeframes contain more short-term movement and market-microstructure noise. Greater chart detail does not guarantee greater accuracy or profitability.
What confirms a CRT setup?
Under a commonly used CRT definition, price first trades beyond the high or low of the reference candle and then closes back inside its range. A wick outside the range alone does not confirm the reclaim.
Is CRT the same as a fake breakout?
Not exactly. A fake breakout describes price moving beyond a level and failing to hold there. CRT uses a defined candle high and low to classify a particular sweep-and-reclaim form of that behaviour.