A young and enthusiastic trader somewhere around the world opens a trading app at 9:18 AM.
Candles are moving fast. Telegram notifications are buzzing. A finance creator on YouTube says a breakout is coming. On the screen, one smooth curved line cuts across the chart like it already knows where the market is headed.
That line is probably a moving average indicator.
Today, almost every Indian trader has seen it. Many trade because of it. Some even trust it blindly.
A moving average has become one of the most commonly used tools in Indian trading because it feels simple. If the price moves above the line, traders feel bullish. If it falls below, panic begins. This crossover often becomes enough reason for people to enter trades with real money.
But there is one problem.
Most traders using moving averages do not fully understand what the tool is actually designed to do.
The tool itself is not useless. In fact, professional traders and institutions still use this type of analysis every single day. The real issue is how retail traders interpret those signals, especially in fast-moving markets like Nifty and Bank Nifty.
Before understanding what traders get wrong, it is important to understand why this tool became so popular in India in the first place.
India’s Trading Boom and the Rise of the Moving Average
India’s stock market has changed dramatically in the last few years.
Before COVID, trading and investing still felt complicated to many people. Opening a Demat account involved paperwork, branch visits, and long waiting periods. Today, someone can start trading directly from a smartphone within minutes.
That shift completely changed India’s market participation.
According to the latest depository data, the number of Demat accounts in India grew from around 4 crore in 2020 to more than 21 crore by the end of 2025. Millions of first-time retail investors entered the market during this period, especially from Tier-2 and Tier-3 cities. Young traders from cities like Surat, Indore, Jaipur, Nagpur, and Lucknow became active participants in equities, options, and intraday trading.
At the same time, social media transformed how people learned trading.
Instead of traditional textbooks or financial courses, many new traders learned through:
- YouTube strategy videos
- Telegram channels
- Instagram reels
- Trading Discord communities
- Short-form “setup-based” content
Most of these systems had one thing in common: the moving-average indicator.
It became the default tool for beginner traders because it looked clean and easy to understand. Unlike complex balance sheets or confusing macroeconomic data, a moving-average gave people something visual.
One line. One signal. One apparent direction.
And because almost every trading platform displays moving-averages by default, traders started seeing them everywhere:
- On Nifty charts,
- Bank Nifty charts,
- Intraday setups,
- Swing trading strategies,
- And even long-term investing videos.
SEBI’s studies also show how dominant retail participation has become in India’s derivatives market. Retail investors now account for a significant share of futures and options activity, especially in index options trading.
The problem is that when millions of new traders enter the market together, simple tools often become oversimplified tools.
And that is exactly what happened with moving-averages.
Before understanding why traders misuse them, let’s first understand what a moving-average indicator actually does and why traders rely on it so heavily.
Suggested Read: 3 Powerful Risk Numbers Every F&O Trader Must Know Before Placing a Trade
What Is a Moving Average Indicator and How Does It Work?
A moving average indicator is one of the simplest tools used in technical analysis.
Its job is not to predict the future.
Its job is to smooth out price movement so traders can understand the overall trend more clearly.
Think about weather temperatures for a moment.
If the temperature changes every single day, the data feels noisy and random. But if someone calculates the average temperature of the last 10 days, the bigger trend becomes easier to notice.
A moving-average works the same way in the stock market.
Instead of averaging temperatures, it averages stock prices.
So rather than focusing on every small candle movement, traders use moving-averages to understand whether prices are generally moving upward, downward, or sideways.
Simple Moving Average (SMA) vs Exponential Moving Average (EMA)
These are the two most commonly used types of moving-averages in India.
Simple Moving Average (SMA)
A simple moving-average gives equal importance to all previous days.
For example:
A 50-day SMA takes the average closing price of the last 50 trading sessions equally.
It moves slowly and is generally used for understanding the bigger trend.
Exponential Moving Average (EMA)
An exponential moving-average gives more importance to recent price movements.
That makes it react faster to sudden market changes.
Because of this, many short-term traders prefer EMA for:
- Intraday trading
- Options trading
- Momentum trading
- Swing trading
In simple words:
- SMA is smoother and slower
- EMA is faster and more sensitive
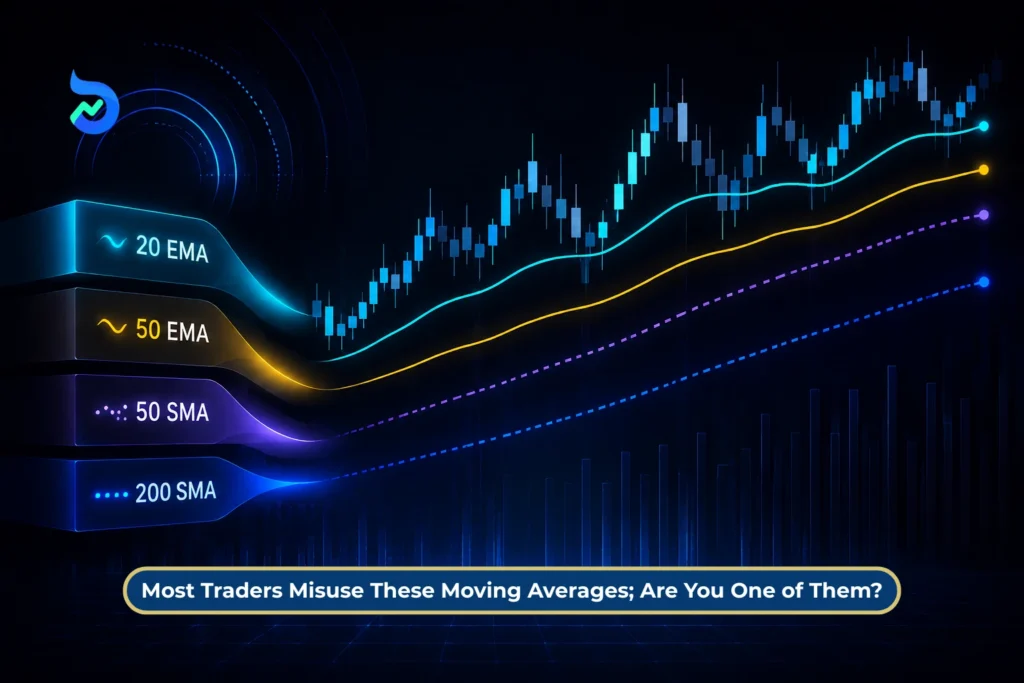
The Most Common Moving Averages Used in India
Different moving averages are used for different trading styles.
| Moving Average | Common Usage |
| 9 EMA | Very short-term momentum |
| 20 EMA | Intraday and swing trading |
| 50 SMA | Medium-term trend |
| 100 SMA | Broader market direction |
| 200 SMA | Long-term trend and investing |
Many traders simply copy these settings from YouTube videos without understanding why they are being used in the first place.
That is where problems begin.
What Is a Moving Average Crossover?
One of the most popular trading strategies in India is the moving-average crossover strategy.
This happens when:
- A faster moving average crosses above a slower moving average, or
- A faster moving average crosses below it.
Traders often treat this crossover as a buy or sell signal.
For example:
- If the 9 EMA crosses above the 20 EMA, traders may see it as bullish.
- If the 9 EMA falls below the 20 EMA, traders may turn bearish.
The logic sounds simple: recent momentum is becoming stronger or weaker.
But markets are rarely that simple in real life.
Golden Cross and Death Cross Meaning
These are probably the most dramatic-sounding terms in technical analysis.
A Golden Cross happens when a shorter-term moving average, usually the 50-day average, crosses above the 200-day moving average.
Traders often interpret this as a strong bullish signal.
The Death Cross is the opposite.
The shorter-term average falls below the long-term average, which traders see as bearish.
News channels, trading groups, and social media often react strongly to these signals because the names sound powerful and important.
But a moving-average indicator is still just a mathematical tool based on past prices.
It does not know:
- Tomorrow’s RBI policy,
- A company’s earnings result,
- Global war news,
- FII activity,
- Or sudden market panic.
And that is exactly why blindly trusting moving-average signals can become dangerous.
Suggested Read: The 7-Day Theta Decay Cycle: When Options Lose Value Fastest & How to Trade Around It
Why Traders in India Fell in Love With Moving Averages
Before criticizing the moving-average indicator, it is important to understand why traders became so attached to it in the first place.
Because honestly, the attraction makes complete sense.
The stock market can feel chaotic, especially for beginners.
Candles move every second. Prices suddenly spike and crash. Financial news changes market sentiment overnight. For someone new to trading, the market often feels like noise.
A moving-average changes that experience instantly.
Instead of random candles everywhere, traders suddenly see a smooth line showing a clearer direction. The market feels less confusing. More organised. More predictable.
That psychological comfort is a huge reason behind the popularity of moving-averages.
It Feels Visual and Certain
Humans naturally look for patterns.
When traders see the price consistently staying above a moving average, they feel confident the market is strong. When the price stays below it, they assume weakness.
A moving average crossover feels even more convincing because it looks like a clear event:
- One line crosses another,
- A signal appears,
- The chart suddenly feels actionable.
For beginners, this feels much easier than understanding:
- Macroeconomics,
- Earnings reports,
- Market positioning,
- Or institutional flows.
The brain prefers simple visual rules.
And moving averages offer exactly that.
Suggested Read: Revenge Trading in Stock Market: Meaning, Psychology, Examples, and 3 Rules to Avoid It
Social Media Made Moving Average Strategies Explode
The rise of financial content creators played a massive role in popularising moving average trading strategies in India.
Search for:
- “Best moving average for intraday trading”
- “9 EMA strategy”
- “Moving average crossover setup”
- “Best indicator for Bank Nifty”
and thousands of videos appear instantly.
Most of them simplify trading into easy formulas:
- “Wait for crossover”
- “Enter after candle close”
- “100% accurate setup”
- “Best indicator strategy”
The profitable examples become thumbnails.
The failed trades rarely become content.
As a result, many traders start believing the moving average indicator alone can consistently predict market direction.
That belief becomes dangerous very quickly.
Suggested Read: Top Social Media Stocks to Invest in for a Trending Portfolio
Every Trading App Already Promotes It
Another reason moving averages became dominant is because every major trading platform already displays them prominently.
Whether someone uses a mobile trading app, a charting platform, or an options terminal, moving averages are usually among the first indicators visible on the screen.
Most beginners never actively choose the indicator.
They inherit it from the platform design itself.
And once traders repeatedly see the same indicator everywhere, it starts feeling like an industry standard that must work.
It Feels Scientific
This is probably the biggest psychological reason of all.
A moving average is based on mathematics.
That makes it feel objective and intelligent.
Many traders assume: “If the line is mathematically calculated, it must be reliable.”
But markets are not physics equations.
A mathematical indicator can still fail badly if it is used in the wrong market condition.
The Tool Was Never Built for Hyperactive Trading
Interestingly, moving averages are much older than most traders realise.
The concept became popular through traders like Richard Donchian in the mid-20th century. These systems were originally designed for slow-moving commodity markets like wheat and cotton, where trends developed gradually over long periods.
They were never designed for:
- 5-minute expiry options,
- High-frequency intraday scalping,
- Or panic-driven social media trading environments.
Yet today, many traders use moving averages as if they are instant prediction machines.
That is where real misuse begins.
Because the tool itself is not broken.
The problem is how traders interpret the signals coming from it.
5 Biggest Moving Average Mistakes Indian Traders Make
The moving average indicator is not dangerous in itself.
The real danger begins when traders treat it like a shortcut to certainty.
Most losses do not happen because traders lack indicators. They happen because traders misunderstand what those indicators are actually telling them.
And moving averages are probably the biggest example of this in Indian trading today.
Here are the five most common moving average mistakes traders make.
Mistake 1: Treating a Moving Average Like a Prediction Tool
This is probably the biggest misunderstanding of all.
A moving average does not predict future prices. It only reacts to prices that have already happened.
That means the indicator is always slightly late by design.
Think of it like driving a car while only looking at the rearview mirror. The mirror gives useful information about where you have been, but it cannot directly show what is about to appear ahead on the road.
A moving average works similarly.
When traders see:
- A bullish crossover,
- Price moving above the line,
- Or a breakout above the moving average,
They often assume the move is just beginning.
But in reality, a large part of the move may already be over.
That is because the moving average needs time and enough previous price data before it can change direction.
The faster the market moves, the more delayed the signal can feel.
This becomes especially risky in:
- Weekly expiry trading,
- Bank Nifty options,
- Momentum spikes,
- And news-driven markets.
By the time the signal appears, smart money may already be reducing positions while retail traders are just entering.
That does not make the moving average useless.
It simply means traders should stop treating it like a crystal ball.
Mistake 2: Using Moving Averages in Sideways Markets
Moving averages are trend-following tools.
They work best when markets are moving clearly in one direction.
The problem is that markets do not trend all the time.
In fact, markets spend a large portion of their time moving sideways.
A sideways market simply means price keeps bouncing within a range without creating a strong uptrend or downtrend.
For example:
- Nifty moves between two levels repeatedly,
- Candles become choppy,
- Breakouts fail quickly,
- And direction keeps changing.
This is where moving average signals become extremely unreliable.
Why?
Because the price keeps crossing above and below the moving average repeatedly without developing a real trend.
This creates something traders call a whipsaw.
What Is a Whipsaw?
A whipsaw happens when:
- Traders get a buy signal,
- Enter the trade,
- Price immediately reverses,
- They exit with a loss,
- And then the market reverses again.
This cycle can repeat multiple times in sideways conditions.
As a result:
- Stop losses keep getting hit,
- Confidence drops,
- And traders start overtrading emotionally.
Many beginners think the indicator failed.
In reality, the market condition itself was unsuitable for a trend-following strategy.
That distinction matters a lot.
Mistake 3: Blindly Trusting Golden Cross and Death Cross Signals
The names themselves sound dramatic.
Golden Cross. Death Cross.
And because the names sound powerful, traders often assume the signals must also be powerful.
Financial media channels love covering these events because they create excitement and fear instantly.
But the reality is much less dramatic than social media makes it appear.
A Golden Cross usually happens when the 50-day moving average crosses above the 200-day moving average.
A Death Cross is the opposite.
These signals are designed to identify long-term trend shifts.
The problem?
By the time the crossover happens, the trend may already be well underway.
In many cases:
- Markets have already rallied strongly before the Golden Cross appears,
- Or markets have already fallen sharply before the Death Cross appears.
That means traders reacting emotionally to these signals are often entering very late.
Even worse, not every crossover leads to a major trend.
False signals happen regularly, especially during uncertain or range-bound markets.
This is why professional traders rarely treat these signals as standalone buy-or-sell commands.
They use them as context, not certainty.
Mistake 4: Using the Wrong Moving Average for the Wrong Goal
Every moving average serves a different purpose.
But many traders use random settings simply because they saw them in a strategy video online.
That creates confusion immediately.
For example:
A 200-day moving average is generally used to understand the long-term trend of a stock or index.
It is useful for:
- Long-term investing,
- Broader market structure,
- And major trend direction.
But many intraday traders still try using it for short-term entry decisions on 5-minute charts.
That makes little practical sense.
Similarly:
- A 9 EMA reacts very quickly,
- While a 50 SMA moves much more slowly.
A short-term trader and a long-term investor should not be using moving averages in the same way.
Using the wrong moving average is like using a cricket bat to play tennis, or a screwdriver to cut wood.
The tool itself is not bad.
It is simply being used for the wrong job.
Mistake 5: Using Moving Averages Alone as the Entire Strategy
This is where most retail trading systems collapse.
A moving average only gives limited information.
It mainly tells traders about:
- Direction,
- Momentum,
- And trend behaviour.
But markets move because of many other forces too.
A moving average does not know:
- Whether RBI policy is tomorrow,
- Whether a company will report weak earnings,
- Whether FIIs are aggressively selling,
- Or whether global markets crashed overnight.
It also cannot fully explain:
- Volume strength,
- Market sentiment,
- Volatility,
- Liquidity,
- Or option positioning.
Yet many traders build entire trading systems using only:
- One moving average,
- One crossover,
- And one entry trigger.
That is usually not enough.
Professional traders combine moving averages with:
- Price structure,
- Risk management,
- Volume analysis,
- Volatility conditions,
- And broader market context.
Because no single indicator can understand the entire market alone.
A hammer is a useful tool. But nobody builds an entire house using only a hammer.
The Numbers That Show Why This Matters
The misuse of moving averages is not just a theory.
The numbers coming out of India’s trading ecosystem show how serious the gap between “using indicators” and “understanding indicators” has become.
India today has millions of active retail traders.
But profitability remains extremely difficult.
According to SEBI’s latest study on India’s derivatives market, nearly 91% of individual traders in the equity F&O segment lost money in FY25.
That is an enormous number.
Even more striking: The combined net losses of retail traders crossed ₹1.05 lakh crore in FY25, which was a major jump compared to the previous year.
The average loss per trader was around ₹1.1 lakh.
And this problem is not limited to options trading alone.
Earlier SEBI studies on intraday trading also found that a large majority of retail intraday traders ended up losing money consistently over time.
Now, moving averages are obviously not the only reason behind these losses.
But they are often part of the pattern.
Why?
Because many traders mistake simple signals for complete trading systems.
A moving average crossover looks easy:
- Line crosses,
- Signal appears,
- Trade gets entered.
But professional trading rarely works that way.
The Difference Between Retail Trading and Institutional Trading
This is where contrast becomes important.
A retail trader may take a trade because:
- The 9 EMA crossed above the 20 EMA,
- Or the price moved above a moving average indicator.
An institutional desk or algorithmic trading system may also look at moving averages.
But that is only one small input inside a much larger decision-making process.
Professional systems often combine:
- Volatility data,
- Order flow,
- Volume behaviour,
- Broader market structure,
- Risk exposure,
- Liquidity conditions,
- Global cues,
- And probability models.
Most importantly, they also know when to ignore a moving average signal.
That is the real edge.
The problem is not that retail traders use moving averages.
The problem is that many traders expect one indicator to do the job of an entire trading framework.
And markets are far more complicated than that.
How Professional Traders Actually Use Moving Averages
After reading all this, a beginner might think:
“So are moving averages useless?”
Not at all.
Professional traders still use moving averages every single day.
The difference is in how they use them.
Retail traders often treat a moving average indicator as a direct buy-or-sell machine.
Experienced traders usually treat it as a tool for context.
That difference changes everything.
Moving Averages as a Direction Filter, Not a Trigger
One of the smartest ways to use a moving average is as a trend filter.
Instead of asking: “Should I enter right now?”
Professional traders first ask: “What side of the market should I even be thinking about?”
For example:
- If a stock is trading above an important moving average, traders may prefer looking for buying opportunities.
- If it is trading below it, they may avoid aggressive long trades.
This helps traders align with the broader trend instead of fighting it constantly.
Legendary trader Marty Schwartz famously used moving averages in a similar way. He treated them like a “green light” or “red light” for market direction, not as automatic entry signals.
That is a much more practical approach than blindly reacting to every crossover.
Moving Averages as Dynamic Support and Resistance
Many traders also use moving averages as areas of support and resistance.
What Does That Mean?
Think of support like a floor.
Prices often bounce from that area because buyers become active there.
Resistance works like a ceiling where prices may struggle to move higher.
Now here is where moving averages become interesting.
In strong trending markets, prices often pull back toward important moving averages before continuing in the original direction.
For example:
- A stock in an uptrend may repeatedly bounce near the 20 EMA,
- Or an index may find support near the 50-day moving average during corrections.
Professional traders do not blindly buy because price touched the line.
Instead, they wait for confirmation:
- Strong candles,
- Rising volume,
- Market strength,
- Or improving momentum.
That combination matters far more than the moving average alone.
Using Moving Averages Alongside Other Signals
A moving average gives limited information by itself.
But when combined with other factors, it becomes much more useful.
Professional traders usually treat indicators like pieces of a puzzle.
For example:
A moving average signal becomes stronger when:
- Volume is increasing,
- The broader market trend agrees,
- Price is breaking an important level,
- Or volatility conditions support the move.
On the other hand, even a strong-looking crossover may be ignored if:
- The market is range-bound,
- RBI policy is approaching,
- Volume is weak,
- Or global markets are unstable.
This is one of the biggest mindset shifts traders need to make.
Indicators should support decision-making.
They should not replace thinking.
Because in real markets, context always matters more than a single line on a chart.
3 Questions to Ask Before Trusting Any Moving Average Signal
Most trading mistakes do not happen because traders lack indicators.
They happen because traders act too quickly without asking the right questions first.
A moving average indicator becomes far more useful when traders slow down and evaluate the context around the signal.
Before entering any trade based on a moving average crossover or trend signal, ask these three questions.
Is the Market Trending or Sideways Right Now?
This is probably the most important question of all.
Moving averages work best in trending conditions.
If the market is clearly moving upward or downward, moving averages can help traders stay aligned with momentum.
But if the market is moving sideways, crossover signals become far less reliable.
In range-bound conditions:
- Price keeps crossing above and below the moving average,
- Trends fail quickly,
- And false entries increase.
Many traders blame the indicator when the real issue is actually the market condition.
A simple rule can help: If the market has no clear direction, avoid aggressively trading moving average crossovers.
Sometimes the best trade is no trade.
Does Anything Else Support the Signal?
A moving average signal becomes much stronger when other factors support it.
For example:
- Is volume increasing?
- Is the broader market moving in the same direction?
- Is price breaking an important support or resistance level?
- Is momentum improving across the sector?
If multiple things agree together, the probability of the setup usually improves.
But if the moving average is the only reason for the trade, that is often a warning sign.
Professional traders rarely rely on one signal alone.
They look for confluence.
That simply means different pieces of market information pointing in the same direction.
Does This Moving Average Match My Trading Goal?
This is where many beginners get confused.
An intraday trader and a long-term investor should not be using moving averages in the same way.
For example:
- A 9 EMA may help short-term traders track fast momentum,
- While a 200-day moving average is more useful for understanding long-term trend direction.
But many traders mix these approaches together randomly.
They use:
- Long-term indicators for short-term trades,
- Or short-term signals for investment decisions.
That usually creates noise instead of clarity.
The moving average should match:
- Your holding period,
- Your trading style,
- And your actual objective.
Because the right tool only works well when it is used for the right purpose.
Final Thoughts: The Problem Was Never the Moving Average
The moving average indicator is not the villain of Indian trading.
It never was.
In fact, it remains one of the most useful tools in technical analysis when used with the right expectations. The real issue begins when traders expect a moving average to do something it was never designed to do.
A moving average cannot predict the future.
It cannot guarantee profits.
And it definitely cannot replace risk management, patience, or market understanding.
But it can help traders simplify trends, understand momentum, and avoid emotional decision-making when used correctly.
India’s trading boom is genuinely historic. Millions of young investors and traders are entering the markets for the first time through smartphones, social media, and easy access to trading platforms. That growth is exciting.
But access to markets and understanding of markets are two very different things.
The future of Indian trading will not depend on which indicator becomes popular next.
It will depend on whether traders learn to understand the tools they already use every day.
Because a moving average is like a rearview mirror in a car.
It is extremely useful. But only when traders remember it was never meant to replace the windshield.
Disclaimer: Investments in securities market are subject to market risks, read all the related documents carefully before investing.
The securities mentioned are quoted as examples and do not constitute a recommendation to buy, sell, or hold any instrument. This blog is for educational purposes only, highlighting common tools and their usage. Always assess your risk tolerance, follow your trading plan, and consult a licensed financial advisor before making any investment decisions.
FAQs
What is meant by moving averages?
Moving averages are technical analysis indicators that calculate the average price of a stock, index, or asset over a specific time period. They help traders smooth out short-term price fluctuations and understand the broader market trend more clearly.
Which is better, 50 EMA or 200 EMA?
The 50 EMA and 200 EMA serve different purposes, so neither is universally better. The 50 EMA reacts faster to price movements and is commonly used for medium-term trend analysis, while the 200 EMA is mainly used to track long-term market direction.
Which EMA is better for intraday?
For intraday trading, many traders prefer using the 9 EMA and 20 EMA because they respond quickly to short-term price movements. These moving averages are commonly used to identify momentum, trend direction, and possible entry or exit opportunities during the trading session.
What are the top 3 moving averages?
The most commonly used moving averages in trading are the 20 EMA, 50 SMA or EMA, and 200 SMA. Traders use them for different purposes, including short-term momentum analysis, medium-term trend tracking, and understanding long-term market direction.