Many traders see Nifty making a lower low while RSI makes a higher low and quickly assume it is a bullish divergence. The next thought is usually simple: buy calls and wait for a reversal. The same happens on the other side. Nifty makes a higher high, RSI makes a lower high, and traders rush to buy puts.
But in Nifty options, this shortcut can be expensive.
RSI divergence does not guarantee that the market will reverse. It only tells you that momentum is not fully supporting the price move. That is an important signal, but it is not enough to take a trade on its own.
Options add another layer of complexity. Even if your market view is right, the trade can still go wrong because of expiry pressure, strike selection, falling implied volatility, theta decay, gamma movement, or lack of clear price confirmation.
This article breaks down RSI divergence in a simple and practical way. We will look at what it actually signals in Nifty options, why traders often misread it, and how it can be used with price action, market structure, and risk management.
By the end, you will see RSI divergence for what it really is: a useful warning sign, not a standalone buy or sell trigger.
What Is RSI?
The Relative Strength Index, or RSI, is a momentum oscillator that measures the speed and strength of recent price changes. It oscillates between 0 and 100. Developed by J. Welles Wilder, the standard setting uses a 14 period lookback, though traders sometimes adjust it for different timeframes.
In simple terms, RSI helps you understand how strongly the price has been moving in a particular direction. If prices have been rising quickly, RSI reflects that upward momentum. If prices have been falling sharply, RSI reflects that downward momentum.
Think of RSI as a speedometer for the market. It shows the pace of the move, but it does not confirm where the market will turn. That is why RSI should be seen as a momentum reading, not a complete trading decision.
For Nifty options traders, RSI is generally used to study momentum in Nifty itself before looking at option trades. This helps traders understand whether the underlying index is moving with strength or showing signs of slowdown.
So, RSI is useful because it simplifies momentum into one reading. But it should be used as part of a broader analysis, not as the only reason to enter or exit a trade.
RSI Levels: What They Mean
RSI moves between 0 and 100. Traders use different RSI zones to understand whether momentum is strong, weak, or neutral. But these levels are not direct buy or sell signals. They only show the current strength of the move.
| RSI Level | What It Indicates | Practical Meaning |
| 70 to 100 | Strong upward momentum | The market is rising with strength. Not an automatic sell signal. |
| 60 to 70 | Bullish strength | Buyers are still active. Trend may continue. |
| Around 50 | Neutral zone | Momentum is balanced. This level often helps judge trend strength. |
| 30 to 40 | Weak momentum | Sellers may have control. Wait for price confirmation. |
| 0 to 30 | Strong downward momentum | The market has fallen sharply. Not an automatic buy signal. |
In simple terms, RSI works like a momentum check. A high RSI means the move is strong, not necessarily over. A low RSI means selling pressure is strong, not necessarily that a bounce is coming.
For Nifty options traders, this matters even more. A correct RSI reading can still fail if the option is affected by expiry, time decay, volatility, or poor strike selection. So, RSI levels should be used with price action, trend, support, resistance, and risk management.
What Is RSI Divergence?
RSI divergence occurs when the price of an asset and the RSI indicator move in opposite directions. This mismatch highlights a potential weakening of the current momentum.
In simple terms, divergence means price is showing one thing, but RSI is not fully supporting it. The market may still be moving up or down, but the strength behind that move may be reducing.
Bullish RSI Divergence
Bullish RSI divergence happens when price makes a lower low, but RSI forms a higher low.
This means the price has fallen further, but the selling pressure is not as strong as before. It can be an early sign that the downtrend is losing strength.
But it does not mean the market will immediately go up. In Nifty options, buying calls only because of bullish divergence can still go wrong if price does not confirm the move.
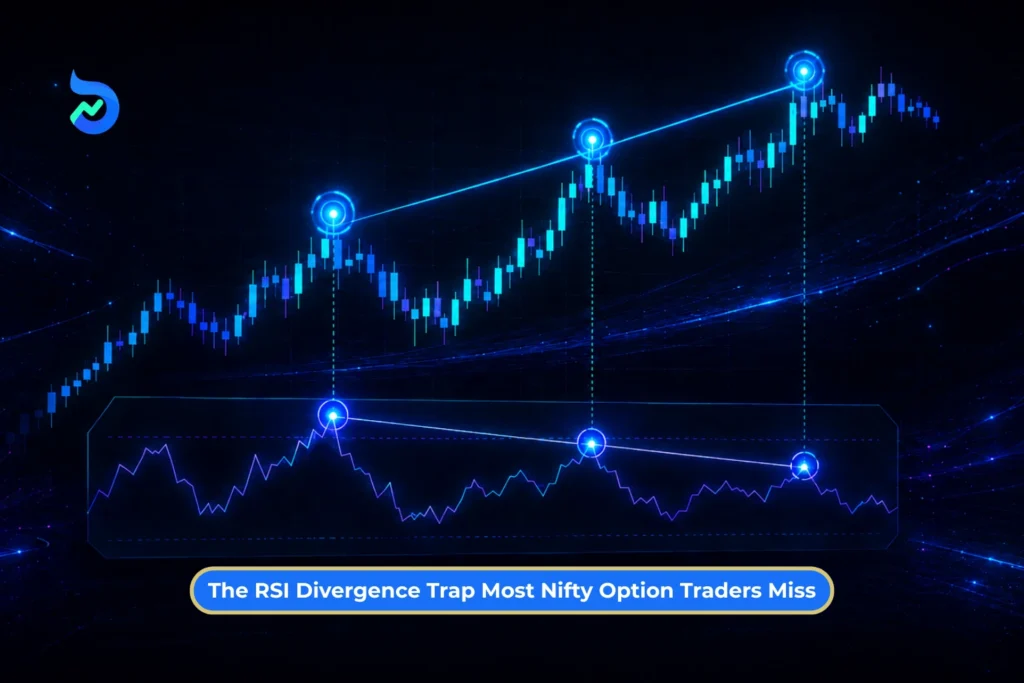
Bearish RSI Divergence
Bearish RSI divergence happens when price makes a higher high, but RSI forms a lower high.
This means the price has moved higher, but buying strength is reducing. It can show that the rally is getting tired.
But again, it does not mean the market will immediately fall. Buying puts only because of bearish divergence can be risky, especially if Nifty continues sideways or expiry pressure affects option premiums.
Hidden Divergence
Hidden divergence is slightly different. It usually appears during a pullback inside an existing trend.
Hidden bullish divergence can appear in an uptrend when price makes a higher low, but RSI makes a lower low. This can suggest that the uptrend may continue.
Hidden bearish divergence can appear in a downtrend when price makes a lower high, but RSI makes a higher high. This can suggest that the downtrend may continue.
The key point is simple: RSI divergence is a warning sign, not a final trading signal. It tells traders that momentum may be changing, but price action, trend, support, resistance, expiry, and risk management must also be checked before taking a trade.
Why RSI Divergence Behaves Differently in Nifty Options
RSI divergence works differently in Nifty options because option prices do not move only because Nifty moves up or down. An option premium is also affected by strike price, time left to expiry, implied volatility, delta, gamma, theta, liquidity, and bid-ask spreads.
For example, Nifty may show bullish divergence and give a small bounce. But if a trader buys a far out-of-the-money call, the option may still not rise much because time decay is reducing its value or implied volatility is falling.
The same can happen with bearish divergence. Nifty may stop rising, but if it only moves sideways, put buyers can still lose money as the premium decays.
This is why direction alone is not enough in Nifty options. Traders also need the right timing, strike selection, and volatility understanding. RSI divergence is more reliable on the Nifty spot or futures chart than directly on option premium charts.
Suggested Read: Why Expiry Day Is the Most Misunderstood Session in F&O, and #1 Rule To Change Your Results
What RSI Divergence Actually Signals in Nifty Options
RSI divergence does not always mean the market will reverse. In Nifty options, it usually gives these signals:
- Momentum may be slowing: A rally or fall may still continue, but the strength behind the move could be reducing.
- The market may pause, not reverse: Many traders think divergence means an immediate trend reversal. But often, Nifty only consolidates for a while and then continues in the same direction.
- It can trigger short-term reversal attempts: In intraday trading, divergence may lead to a quick bounce or dip. But without follow-through, the move can fade quickly.
- It warns against late entries: After a sharp move, divergence can be a sign that chasing fresh calls or puts may be risky.
- It can work better as an exit signal: Divergence is often more useful for booking partial profits, tightening stop-losses, or reducing risk than for taking a fresh trade.
- It helps traders ask the right question: Instead of asking, “Should I reverse my trade now?”, traders should ask, “Is the current move losing strength, and should I avoid chasing it?”
In simple terms, RSI divergence is a warning sign. It does not force a reversal, but it helps traders read momentum better and manage risk more carefully in Nifty options.
Suggested Read: Why Moving Averages Are India’s Most Used Yet Most Misused Trading Tool: 20 EMA, 50 EMA, 50 SMA & 200 SMA
7 Mistakes Traders Make While Reading RSI Divergence
RSI divergence can be useful, but many traders misread it, especially in Nifty options. Here are the 7 common mistakes:
Mistake1: Treating Every Divergence as a Reversal
This is the biggest mistake. A bearish divergence does not always mean Nifty will crash. In a strong uptrend, it may only lead to a small pullback. Similarly, bullish divergence in a downtrend may only create a weak bounce before the fall continues.
Mistake 2: Ignoring the Higher Timeframe
A 5-minute bullish divergence may look strong on an intraday chart. But if the daily trend is clearly weak, the bounce may not last. Higher timeframe trend often has more weight than a small timeframe signal.
Mistake 3: Using RSI on Illiquid Option Strikes
Far out-of-the-money options can move in sudden jumps because of low liquidity and wide bid-ask spreads. This can make RSI readings look unreliable. The signal may reflect premium noise, not real market momentum.
Mistake 4: Buying Options Too Close to Expiry
Near expiry, option premiums lose value quickly because of theta decay. Even if Nifty moves slightly in the expected direction, the option may not gain enough. This is why divergence trades near expiry need faster and stronger price movement.
Mistake 5: Ignoring Implied Volatility
Option prices are also affected by implied volatility. If IV falls after an event or during sideways movement, premiums can drop even when Nifty does not move much against the trade. This can hurt both call and put buyers.
Mistake 6: Entering Before Price Confirmation
Divergence can stay on the chart for several candles before anything actually happens. Entering too early can lead to avoidable stop-losses. It is better to wait for price confirmation, such as a breakout, breakdown, or clear rejection from a key level.
Mistake 7: Confusing Option Chart Divergence With Nifty Divergence
RSI on an option premium chart can be misleading because option prices are affected by Greeks, expiry, volatility, and liquidity. For cleaner signals, traders usually check RSI divergence on the Nifty spot or futures chart first.
In short, RSI divergence is not the trade. It is only a signal to slow down, check the broader setup, and avoid chasing momentum blindly.
Suggested Read: Checking P&L During Market Hours is Killing Your Trading Returns: 8 Stages of Rule Breaking
How to Read RSI Divergence Correctly in Nifty Options
A structured framework improves results when using RSI divergence.
Step 1: Begin with the Nifty spot or futures chart.
Identify divergence there first and treat option premium charts as secondary confirmation.
Step 2: Assess the overall market structure.
Determine if Nifty is trending or range bound. Check proximity to support, resistance, VWAP, or key intraday levels. Evaluate whether the divergence follows an extended move.
Step 3: Demand confirmation.
Look for a break of a minor trendline, a higher high following bullish divergence, a lower low after bearish divergence, strong candle closes, or rejection at important levels like VWAP.
Step 4: Select appropriate strikes.
For buying options, favor at the money or slightly in the money contracts that track the underlying more closely. Extremely far out of the money strikes are cheap but respond poorly due to low delta.
Step 5: Account for expiry risk.
Signals near expiry demand faster resolution. Small expected moves may not justify long option positions given theta pressure.
Step 6: Define invalidation levels clearly.
A bullish divergence setup fails if Nifty breaks the recent swing low convincingly. This protects capital when the signal does not play out.
This approach diverges from vague observation into a disciplined part of a larger trading plan.
Best Market Conditions for RSI Divergence
RSI divergence works better when the market is already showing signs of tiredness. It should not be used in isolation, but it can become useful when the setup has the right context.
1. When price is near support or resistance
Divergence becomes more meaningful when Nifty is close to an important support or resistance zone. For example, if Nifty is falling near support and bullish divergence appears, it may suggest that selling pressure is reducing.
2. After a sharp one-sided move
RSI divergence works better after Nifty has already moved strongly in one direction. A long rally or a sharp fall can make the move stretched. In such cases, divergence can act as an early warning that momentum is slowing.
3. When candles show exhaustion
If divergence appears along with small candles, long wicks, failed breakouts, or failed breakdowns, the signal becomes stronger. It shows that the market is trying to move further but does not have enough strength.
4. When the market is not in a strong breakout
Divergence often fails during powerful breakout or breakdown phases. In such markets, momentum can stay strong for longer, and price may continue moving even if RSI shows divergence.
5. When there is price confirmation
Divergence alone is not enough. Traders should wait for confirmation, such as price breaking a minor trendline, reclaiming an important level, or rejecting from resistance. This helps avoid early entries.
6.When expiry pressure is not too high
In Nifty options, divergence is harder to trade near expiry because premiums can decay quickly. Even if the direction is right, the option may not move enough. So, divergence works better when there is enough time for the trade to play out.
In simple terms, RSI divergence works best near key levels, after stretched moves, and with price confirmation. It works poorly when Nifty is moving strongly in one direction or when expiry pressure is too high.
Suggested Read: Revenge Trading in Stock Market: Meaning, Psychology, Examples, and 3 Rules to Avoid It
Example Framework: Bullish and Bearish Divergence in Nifty Options
Consider hypothetical scenarios based on typical market behavior.
Example 1: Bullish Divergence
Nifty declines from 23200 to 23050, attempts a bounce, then retests 23020. RSI forms a higher low during the second decline.
Wrong approach: Buy calls immediately upon spotting divergence.
Better approach: Recognize weakening selling pressure. Wait for Nifty to reclaim a minor resistance level or print a higher high on the chosen timeframe. Then evaluate if the strike, expiry, and risk reward align with the expected move. Factor in theta and potential volatility changes before committing capital.
Example 2: Bearish Divergence
Nifty advances from 23000 to 23180, pulls back slightly, then pushes to 23220 while RSI registers a lower high.
Wrong approach: Immediately purchase puts.
Better approach: Note that buying momentum may be waning. Monitor for a break below minor support or rejection at resistance. If price merely consolidates sideways, put positions can still erode due to time decay even without strong downward movement. Confirmation and proper position sizing are vital.
These frameworks emphasize patience and confirmation over impulsive reactions. (Word count: 318)
A Simple Checklist Before Trading RSI Divergence in Nifty Options
Use this checklist to evaluate setups objectively.
- Does the divergence appear clearly on the Nifty spot or futures chart rather than solely on the option premium?
- Is the broader market trending or range bound?
- Is price positioned near meaningful support, resistance, VWAP, or other key levels?
- Has price action provided confirmation such as a structure break or strong candle?
- How much time remains until expiry?
- Is the chosen option strike sufficiently liquid?
- Is the option at the money, in the money, or excessively far out of the money?
- Is implied volatility rising, stable, or falling?
- What is the defined stop loss level?
- What is the maximum acceptable loss for the position?
If the setup fails multiple items on this checklist, treat the divergence as an observation only, not a tradable signal. This discipline separates consistent traders from those relying on hope.
Suggested Read: F&O Trading in Volatile Markets: How to Use Greeks (Delta, Theta, Vega) Effectively
Bottom Line
RSI divergence can be a helpful signal, but only when traders understand what it is really saying. It does not say, “Buy now” or “Sell now.” It simply says that the current price move may be losing momentum.
In Nifty options, this difference matters a lot. A small bounce, a delayed move, falling implied volatility, wrong strike selection, or fast theta decay can still hurt the trade even when the market view is partly right. That is why divergence should never be used as a shortcut.
The better approach is to treat RSI divergence as an early warning sign. First, check it on the Nifty spot or futures chart. Then look at the trend, support, resistance, market structure, expiry, option liquidity, and price confirmation. Only when these factors support the setup should it become a trade idea.
For beginners, the lesson is simple: divergence is not magic. For experienced traders, the reminder is equally important: momentum signals work best with discipline.
In options trading, the edge is not in reacting first. It is in reacting wisely.
Disclaimer: Investments and trading in the securities market are subject to market risks, read all related documents carefully before investing or trading.
Futures and options trading involves substantial risk and may not be suitable for all investors. RSI divergence and other technical indicators are shared for educational and informational purposes only and should not be treated as standalone buy or sell signals. Past performance, chart patterns, or indicator readings do not guarantee future results. Please consult a qualified financial advisor before making any investment or trading decision.
FAQs
What is the best RSI setting for divergence?
The standard RSI setting for divergence is usually 14 periods, as introduced by J. Welles Wilder. Many traders use it on daily, hourly, or intraday charts. Shorter settings react faster but create more false signals. Longer settings are smoother but slower. For Nifty options, traders usually check RSI divergence on Nifty spot or futures first.
What happens when RSI divergence?
RSI divergence happens when price and RSI move in opposite directions. It usually signals that the current momentum may be weakening. A bullish divergence can show that selling pressure is reducing, while a bearish divergence can show that buying strength is fading. However, divergence does not guarantee reversal. Price confirmation is still important before taking any trade.
How to use RSI for divergence?
To use RSI for divergence, first check the Nifty spot or futures chart. Compare price highs and lows with RSI highs and lows. If price makes a lower low but RSI makes a higher low, it may be bullish divergence. If price makes a higher high but RSI makes a lower high, it may be bearish divergence. Always confirm with price action.
Is RSI divergence profitable?
RSI divergence can be useful, but it is not automatically profitable. It works better when combined with trend, support, resistance, price confirmation, expiry, volatility, and risk management. In Nifty options, even a correct directional view can fail because of theta decay, wrong strike selection, or falling implied volatility. Treat divergence as a warning signal, not a guaranteed trade.