Most traders already know the feeling. You enter a well-planned trade with your stop-loss and target clearly defined. The setup looked solid on the chart. Yet within minutes you find yourself refreshing that P&L box far more often than you check the actual price action. Green numbers bring a rush of confidence. Red numbers create instant tension. Before long the focus shifts from reading the market to monitoring your emotions in real time. This habit is incredibly common among retail traders in India, and it quietly undermines results more than many realise.
The live P&L box looks like helpful data. For most traders, however, it functions as emotional noise that interferes with clear decision-making.
This article is not suggesting you ignore risk. It is about creating separation between trade management and constant money tracking so you can follow your plan with a calmer mind. You will learn why frequent checks during market hours hurt performance and what practical alternatives actually help.
Let’s dive in!
What Is Live P&L?
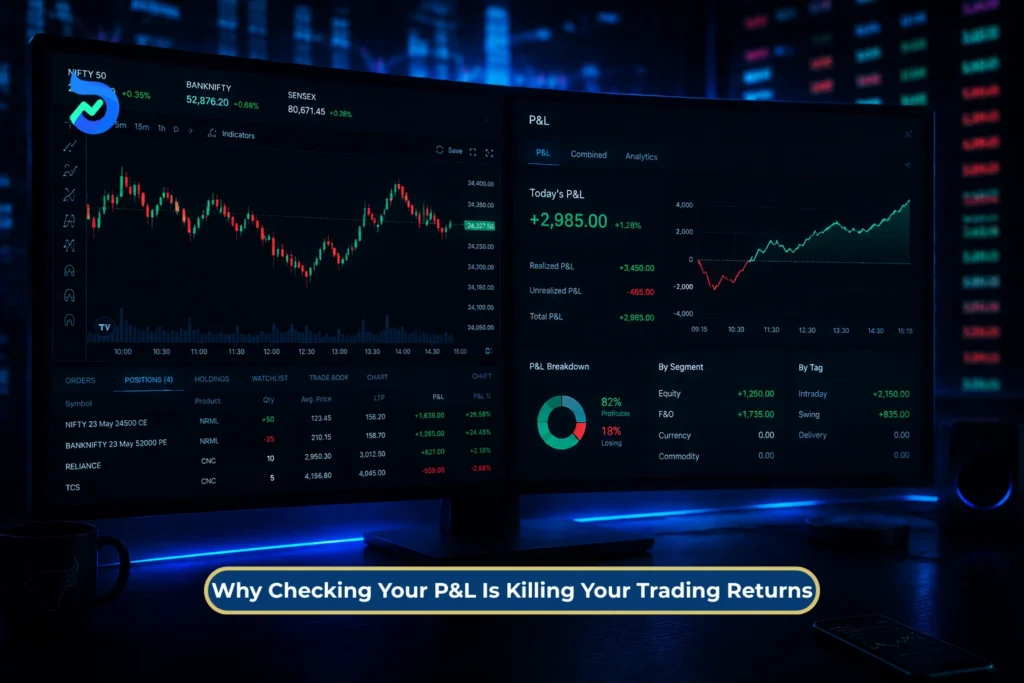
Live P&L (Profit and Loss) is the real-time profit or loss displayed on your trading platform while your position is still open. As market prices move throughout the trading session, your live P&L updates continuously to show how much money you are currently making or losing.
For example, if you buy shares of a stock at Rs. 1,000 and the price rises to Rs. 1,020, your live P&L will show an unrealized profit. If the stock falls to Rs. 980, it will show an unrealized loss. The key word here is “unrealized” because the gain or loss only becomes final when you close the position.
For many traders, especially intraday and F&O traders, live P&L becomes the most watched number on the screen. Every tick in the market translates directly into rupees gained or lost, creating a constant stream of emotional feedback.
What Does Live P&L Include?
Most trading platforms display several components alongside the live P&L:
Unrealized Profit or Loss
This is the profit or loss on your open positions based on the current market price. It changes every second as prices move.
Realized Profit or Loss
This represents the profit or loss from trades that have already been closed during the trading session.
Day P&L
This shows the total profit or loss generated during the current trading day, including both open and closed positions depending on the platform.
Percentage Return
Some platforms display the gain or loss as a percentage of the capital deployed instead of only showing the rupee value.
Mark-to-Market (MTM)
Commonly used in futures and options trading, MTM reflects the current value of open positions based on prevailing market prices.
Charges and Costs
Advanced platforms may also estimate brokerage, exchange charges, GST, STT, and other transaction costs to provide a more realistic profit or loss figure.
Why Traders Become Obsessed With It
Unlike charts, indicators, or company fundamentals, live P&L speaks a language everyone understands: money. A Rs. 2,000 loss feels far more personal than a stock moving down by 1%.
This is where the problem begins.
When traders focus excessively on live P&L, they often stop evaluating whether their trade setup is still valid and start reacting emotionally to the money gained or lost on the screen. As a result, trading decisions become driven by fear, greed, relief, and frustration rather than by a well-defined strategy.
Why Live P&L Feels So Powerful
Every price movement on the chart is neutral information. The market moved 0.3 percent. That is simply data. But the same movement translated into your P&L becomes deeply personal. You just lost 2000 rupees feels far more urgent than a small price update.
Red numbers trigger a threat response in the brain. Green numbers deliver quick satisfaction. Both pull attention away from the trade setup itself. Instead of evaluating whether the price action still matches the original thesis, you start reacting to the changing account balance. A chart provides market feedback. A live P&L provides emotional feedback. Over repeated exposures many traders end up managing their feelings rather than managing the position.
This happens quickly because the feedback is continuous. In volatile sessions small fluctuations create large perceived swings in success or failure. The brain treats each swing as an event that requires an immediate reaction even when the trade structure has not changed.
The Behavioural Finance Problem: Why Your Brain Hates Seeing Losses
Behavioural finance has a term for this: myopic loss aversion.
In simple words, people tend to focus too much on short-term losses and check their performance too often. The more frequently traders look at their live P&L, the more often they see small losses, even when nothing is actually wrong with the trade.
The problem is that losses hurt more than gains feel good. Losing Rs. 1,000 feels much more painful than the happiness of making Rs. 1,000. As a result, every red number on the screen creates stress and pushes traders to react emotionally.
Imagine a trader buys Nifty options with a planned stop-loss of Rs. 5,000. A few minutes later, the position shows a loss of Rs. 1,200. The trade setup is still valid. The stop-loss hasn’t been hit. Nothing has changed.
But the trader keeps staring at the red P&L figure and starts feeling uncomfortable. Instead of following the original plan, they exit the trade early.
A short while later, the market reverses and moves in the expected direction.
The mistake wasn’t the trading strategy. The mistake was allowing temporary discomfort to override the trading plan.
This happens more often than most traders realize. Every time you check your P&L, you expose yourself to another emotional reaction. The more often you check, the more likely you are to make impulsive decisions.
That’s why successful traders focus on their setup, risk levels, and trading rules during market hours, not on every small fluctuation in their profit and loss.
Suggested Read: Revenge Trading in Stock Market: Meaning, Psychology, Examples, and 3 Rules to Avoid It
How Live P&L Makes Traders Break Their Own Rules
Most traders do not intentionally ignore their trading plan. The process usually starts with a simple glance at the live P&L and gradually turns into a series of emotional decisions.
Stage 1: Focus Shifts From the Setup to the P&L
A trader enters a position with a predefined entry, target, and stop-loss. Initially, the focus is on the chart, price action, and market conditions.
As the trade progresses, attention slowly shifts towards the profit and loss figure. Instead of monitoring whether the trade setup remains valid, the trader becomes more concerned about how much money is being made or lost.
At this point, the trade is no longer being evaluated based on market conditions alone.
Stage 2: Emotions Start Influencing Decisions
As the P&L fluctuates, emotions begin to appear.
A small profit creates excitement and relief. A small loss creates discomfort and anxiety. Even though the trade may still be behaving exactly as expected, the trader starts reacting to the monetary outcome rather than the original analysis.
The market has not changed, but the trader’s emotional state has.
Stage 3: The Original Trading Plan Begins to Change
Once emotions enter the decision-making process, the trading plan starts to bend.
Profitable trades are often exited before reaching their intended target because the trader wants to secure the gains already visible on the screen.
Losing trades receive more room than originally planned because accepting the loss feels uncomfortable.
The rules that were created before entering the trade begin to lose importance.
Stage 4: Risk Management Starts Breaking Down
As the trade moves closer to the stop-loss, many traders adjust their risk parameters.
A stop-loss that was carefully chosen before the trade is moved further away. Position sizes may be increased in an attempt to improve the average entry price. Risk limits that were supposed to protect capital become flexible.
What started as a controlled trade gradually becomes an uncontrolled one.
Stage 5: Frustration Builds
When profitable trades continue moving higher after an early exit, regret starts to appear.
When losing trades continue moving lower after the stop-loss is moved, frustration begins to build.
The trader becomes less focused on following a process and more focused on the money that could have been made or lost.
Emotional pressure continues increasing throughout the session.
Stage 6: Revenge Trading Appears
After one or two disappointing outcomes, many traders attempt to recover losses quickly.
Instead of waiting for high-quality opportunities, they begin taking trades that do not fully meet their criteria. Position sizes may increase, and trade selection becomes less disciplined.
The objective shifts from executing a strategy to recovering lost money.
This is where some of the largest trading mistakes occur.
Stage 7: Overtrading Takes Over
Once emotions dominate decision-making, activity often increases dramatically.
Every market movement appears to be an opportunity. Trades are entered more frequently, often without the same level of analysis that existed earlier in the day.
As the number of trades increases:
- Brokerage costs rise.
- Slippage increases.
- Errors become more common.
- Decision quality declines.
The trader spends more energy reacting to short-term outcomes than following a structured plan.
Stage 8: The Final Outcome Suffers
By the end of the trading session, the damage is rarely caused by the first trade alone.
Instead, it comes from the chain reaction created by repeatedly watching and reacting to the live P&L.
Winning trades are cut short. Losing trades become larger than planned. Risk management weakens. Trading discipline disappears.
The result is often lower returns, greater stress, and a growing gap between the trader’s strategy and actual performance.
This is why experienced traders focus on managing the trade setup, risk levels, and execution process during market hours. The live P&L may show what is happening to the position, but it should not be allowed to dictate every trading decision.
Suggested Read: The 7-Day Theta Decay Cycle: When Options Lose Value Fastest & How to Trade Around It
Why This Problem Is Bigger in Intraday and F&O Trading
The challenge is especially sharp for intraday and derivatives traders in India. Markets move fast and leverage magnifies every tick. A modest one percent move in the underlying can cause sharp swings in option premiums. What feels minor on a delivery stock chart can feel like a crisis in F&O.
In longer-term investing daily fluctuations rarely feel urgent. In options the same moves create immediate and large P&L changes. Faster swings increase emotional intensity.
SEBI data shows the scale. Over 90% of individual F&O participants lose money over time. Aggregate annual losses for retail traders have crossed one lakh crore rupees in recent years. Frequent traders tend to lose even more. Constant P&L checking is not the sole cause but it amplifies many behaviours that drive these results.
The Illusion of Control
Many traders check P&L because it creates a sense of being in control. They feel that watching numbers closely keeps them safe. In practice watching the money does not improve trade quality. What does improve results are better entries, proper position sizing, strict stop-loss adherence, trade journaling and reviewing patterns after hours.
Monitoring account movement is not the same as managing the trade. Real control comes from processes built during calm moments rather than reactions to live numbers.
Suggested Read: Confirmation Bias in Trading: Why Traders Find 10 Inspiring Reasons to Enter but Zero Reasons to Exit
What Traders Should Track Instead During Market Hours
Most traders spend too much time watching their live P&L and too little time monitoring the factors that actually matter. Instead of focusing on every rupee gained or lost, follow these four steps whenever you’re managing an open position.
Step 1: Check Whether the Trade Setup Is Still Valid
The first thing to review is the reason you entered the trade.
Look at whether price action is still supporting your original trading idea. Check if key support or resistance levels remain intact, whether the trend is behaving as expected, and whether volume and market conditions continue to support the setup.
If the trade thesis remains unchanged, there may be no reason to take any action.
Step 2: Check Whether Risk Is Still Within Your Plan
Once you’ve confirmed the setup is valid, review your risk management.
Ensure the stop-loss remains in place, position size is unchanged, and the maximum potential loss is still within your acceptable limit. This step helps prevent emotional decisions such as averaging down, increasing exposure, or moving stop-loss levels.
Risk management should always take priority over short-term profit fluctuations.
Step 3: Check Whether an Exit Condition Has Been Triggered
Every trade should have predefined conditions for exiting.
Review whether the trade has reached its profit target, hit the stop-loss, activated a trailing stop, or reached a time-based exit point. If none of these conditions have occurred, the trade may simply require patience.
Allowing the trade to follow the original plan can often produce better outcomes than reacting to temporary price movements.
Step 4: Check Your Emotional State
The final step is to assess your mindset before making any decision.
Pay attention to signs of fear, impatience, frustration, overconfidence, or the urge to recover previous losses. Emotional states can influence decision-making far more than most traders realize.
A trader who is calm and objective is far more likely to follow the plan than a trader who is focused on recovering losses or protecting small profits.
Focus on the Process, Not the P&L
During market hours, successful traders spend more time evaluating the quality of their setup, risk levels, exit conditions, and decision-making process than monitoring every change in their profit and loss.
The market rewards disciplined execution over emotional reactions. By focusing on what you can control rather than what your live P&L is showing at every moment, you give yourself a much better chance of achieving consistent results over time.
Suggested Read: Time vs Timing: What is More Important in Stock Market?
The Better Trading Screen Setup
| Element | Keep Visible / Minimise | Purpose |
| Large, clear chart | Keep Visible | Helps you focus on price action and market structure. |
| Support and resistance levels | Keep Visible | Keeps attention on key trading zones and decision points. |
| Entry price, target, and stop-loss | Keep Visible | Ensures trades are managed according to plan. |
| Open position details | Keep Visible | Helps monitor positions without focusing on profits or losses. |
| Market trend or index direction | Keep Visible | Provides broader market context for better decisions. |
| Clean watchlist | Keep Visible | Makes it easier to track opportunities without clutter. |
| Overall day P&L | Minimise | Reduces emotional reactions to gains and losses. |
| Unrealised profit/loss | Minimise | Prevents premature exits and unnecessary adjustments. |
| Profit/loss notifications | Minimise | Reduces distractions during active trading. |
| Account balance updates | Minimise | Keeps focus on execution rather than money fluctuations. |
| Unnecessary indicators | Minimise | Removes noise and improves clarity. |
| Excess widgets and tools | Minimise | Helps maintain a clean and disciplined workspace. |
The objective is simple: keep information that helps you make better trading decisions and reduce information that encourages emotional decision-making. During market hours, the chart should be the centre of attention, not the P&L.
A Simple Rule: Check P&L Only at Fixed Times
Create structure with fixed review points.
Intraday traders should define maximum daily loss before the open. Focus on charts, setups and stops during trading. Record details after each exit. Review full P&L only after market close.
Swing traders can limit checks to once or twice a day. Concentrate on thesis and key levels.
Longer-term investors review on weekly, monthly or quarterly cycles based on strategy. Avoid daily mark-to-market reactions.
What to Do When You Feel the Urge to Check P&L
When the urge hits pause and follow this sequence. Stop. Look at the chart and levels instead of the number. Ask if anything material has changed in the setup. If nothing has changed then do nothing. If the setup has failed exit according to the original plan.
The urge is often less about needing information and more about seeking emotional reassurance. Recognising this difference helps you respond calmly.
The Real Goal Is Not to Avoid Losses
Successful trading does not mean eliminating losses. Losses are normal when taking calculated risks. The aim is to accept planned losses, avoid emotional ones, let winning trades develop fully, prevent single bad trades from ruining a day and stop bad days from damaging the account.
Suggested Read: Best Time to Trade Commodities in India: Market Timings, Active Hours, and Smart Trading Windows
Build a Pre-Trade, During-Trade, and Post-Trade Checklist
A simple checklist can help you stay focused on your process instead of your live P&L. By following the same routine before, during, and after every trade, you can reduce emotional decision-making and improve consistency.
Pre-Trade Checklist
| Checkpoint | Why It Matters |
| Confirm the trade setup | Ensures there is a valid reason for entering the trade. |
| Define the entry level | Prevents impulsive entries and chasing prices. |
| Set the stop-loss | Establishes maximum risk before entering the trade. |
| Set the target | Creates a clear profit-taking plan. |
| Calculate the maximum loss | Ensures the risk fits within your trading plan. |
| Identify the invalidation point | Defines exactly when the trade idea becomes wrong. |
| Check your mindset | Helps avoid trades driven by fear, greed, boredom, or revenge. |
During-Trade Checklist
| Checkpoint | Why It Matters |
| Verify the setup is still valid | Keeps focus on market conditions rather than P&L fluctuations. |
| Monitor key support and resistance levels | Helps assess whether the trade is behaving as expected. |
| Check if the stop-loss has been hit | Ensures risk management rules are followed. |
| Check if the target has been reached | Prevents unnecessary hesitation when exit conditions are met. |
| Avoid changing rules because of P&L | Reduces emotional decisions such as moving stop-losses or booking profits too early. |
| Stay aware of your emotions | Helps identify fear, frustration, overconfidence, or impatience before they affect decisions. |
Post-Trade Checklist
| Checkpoint | Why It Matters |
| Review whether you followed the plan | Measures discipline, not just profitability. |
| Evaluate whether the entry was rule-based | Helps identify impulsive or low-quality trades. |
| Evaluate whether the exit was rule-based | Ensures consistency in trade management. |
| Check for signs of overtrading | Helps control unnecessary activity and trading costs. |
| Record lessons learned | Turns every trade into a learning opportunity. |
| Identify one improvement for the next session | Encourages continuous development as a trader. |
The goal of this checklist is simple: plan carefully before the trade, stay disciplined during the trade, and learn from the trade afterward. Over time, this process can have a much bigger impact on trading results than constantly watching your live P&L.
Bottom Line
Watching your live P&L during market hours may feel necessary, but it quietly undermines results more than most traders realize. Every flicker of green or red pulls attention away from the trade setup and into your emotions. It triggers fear, greed, impatience, and the urge to react impulsively, which leads to early exits, larger losses, and overtrading. The market itself has not changed, your mindset has.
The key to consistent results is separating trade management from moment-to-moment money tracking. Focus on the chart, your setup, and predefined risk rules. Use pre-trade, during-trade, and post-trade checklists to stay disciplined and make decisions based on process, not emotional reactions. Simplify your screen, reduce distractions, and check P&L only at fixed times. By doing this, you let your trades develop according to plan, take losses that are calculated, and allow winners to reach their potential.
Over time, this approach builds patience, reduces stress, and improves your trading consistency. Live P&L can inform you but it should never control you. Master the process and the profits will follow.
Disclaimer: Investments in the securities market are subject to market risks, read all related documents carefully before investing.
Past performance is not indicative of future returns. The information in this blog is for educational purposes only and is not a recommendation to buy, sell, or hold any security. Traders should follow their trading plan, manage risk responsibly, and consult a licensed financial advisor if needed.
FAQs
How to check volume inlive market?
Traders watch volume to understand market strength. Focus on how many shares or contracts are being exchanged compared to recent levels. Rising prices with strong volume indicate conviction, while low volume may signal weak moves. Look at volume in context with price action to gauge whether buyers or sellers are dominating the market.
How to evaluate a P&L?
To evaluate a P&L, review both realized and unrealized profits and losses for all positions. Compare gains and losses against your trade plan, risk limits, and position sizes. Analyze which trades performed as expected and which did not, identifying patterns or mistakes. Use this review to refine strategies, improve risk management, and maintain consistent trading performance over time.
How to check P&L report?
A P&L report summarizes trade outcomes. Traders track both unrealized and realized profits and losses to understand which trades are performing and which are not. Reviewing P&L regularly allows them to evaluate risk management, see patterns in performance, and plan adjustments without reacting to every short-term fluctuation.
How to make my P&L healthy?
Healthy P&L comes from disciplined trading. Stick to pre-defined entries, exits, stop-losses, and position sizes. Avoid reacting to every small market move. Review trades after sessions to learn from mistakes, let profitable trades run, and cut losses quickly. Consistent risk management and process-focused decisions gradually improve overall performance.