

Smart Money Concepts, or SMC, is a way of reading price charts more systematically. It looks at how the market forms highs and lows, where liquidity may be concentrated, how strongly price moves in one direction, and where it may react later. Traders use it to study swing points, sharp price movements, candle patterns, and what happens when price returns to an earlier zone.
However, SMC should not be mistaken for a direct view of institutional activity. A candlestick chart cannot tell us exactly who placed an order, how large it was, or whether an institution was responsible for a particular move. That is why the SMC tools are better treated as areas for closer analysis rather than guaranteed trading signals, without making assumptions about who is controlling every price movement.
In this blog, we will explain these concepts in simple terms and show how traders can analyse them consistently while considering the structure, liquidity, execution conditions, and practical realities of Indian financial markets.
Let’s dive in!
What Are Smart Money Concepts?
“Smart money” is a general term used for large and experienced market participants, such as banks, HNIs, funds and institutions.
In Smart Money Concepts, or SMC, traders study price movements to understand where strong buying or selling pressure may have appeared.
What Does the SMC Framework Include?
The SMC framework mainly covers:
- Market structure
- Liquidity
- Displacement
- Order blocks
- Fair value gaps
- Inducement imbalance
These are widely used trading terms, but they are not officially standardised by NSE or SEBI. Therefore, different traders, educators and charting tools may define or mark them differently.
How Is SMC Different from Order-Flow Analysis?
SMC mainly studies price charts and candlestick behaviour.
Order-flow analysis studies actual market information, such as:
- Buy and sell orders
- Completed trades
- Cancelled orders
- Market depth
NSE follows an order-driven system. Orders are matched first by price and then by time.
What Is the Main Limitation?
The NSE order book is anonymous. This means a normal candlestick chart cannot show who placed a particular order.
Research shows that order-flow imbalance and market depth can affect short-term prices. However, this does not prove that every order block or fair value gap was created by an institution.
Suggested Read: Can the 100-Year-Old Gann Square of 9 Really Map Nifty Levels With Surprising Accuracy?
Essential SMC Terms to Remember
Before studying order blocks and Fair Value Gaps in detail, it helps to understand the main terms used in Smart Money Concepts. These definitions are not officially standardised, so traders should use clear rules and avoid changing them from one chart to another.
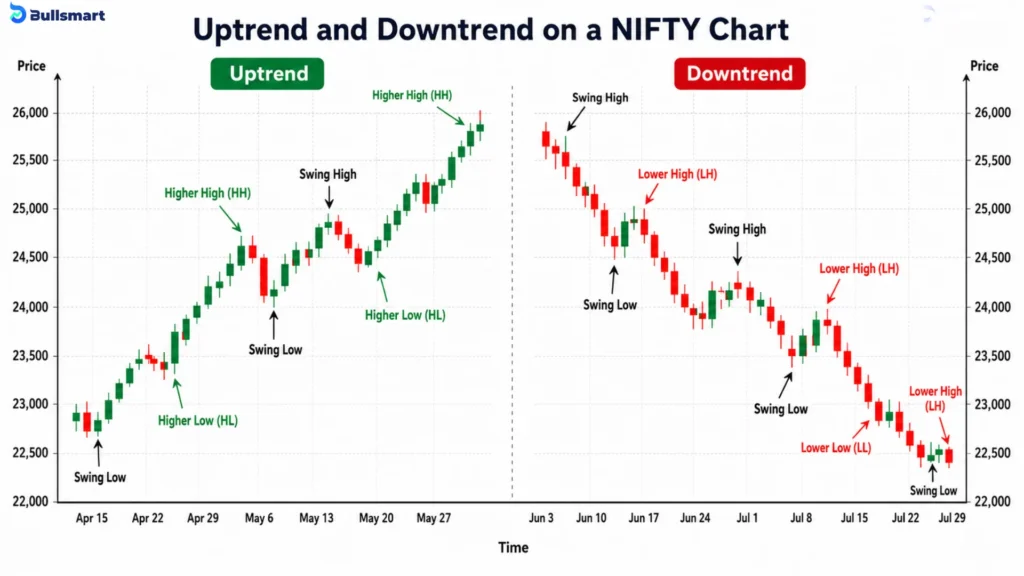
1. Market Structure
Market structure explains how price forms important highs and lows.
- An uptrend generally forms higher highs and higher lows.
- A downtrend generally forms lower highs and lower lows.
- When neither pattern continues clearly, the market may be consolidating or moving sideways.
Market structure provides the broader context for analysing other SMC concepts.
2. Break of Structure
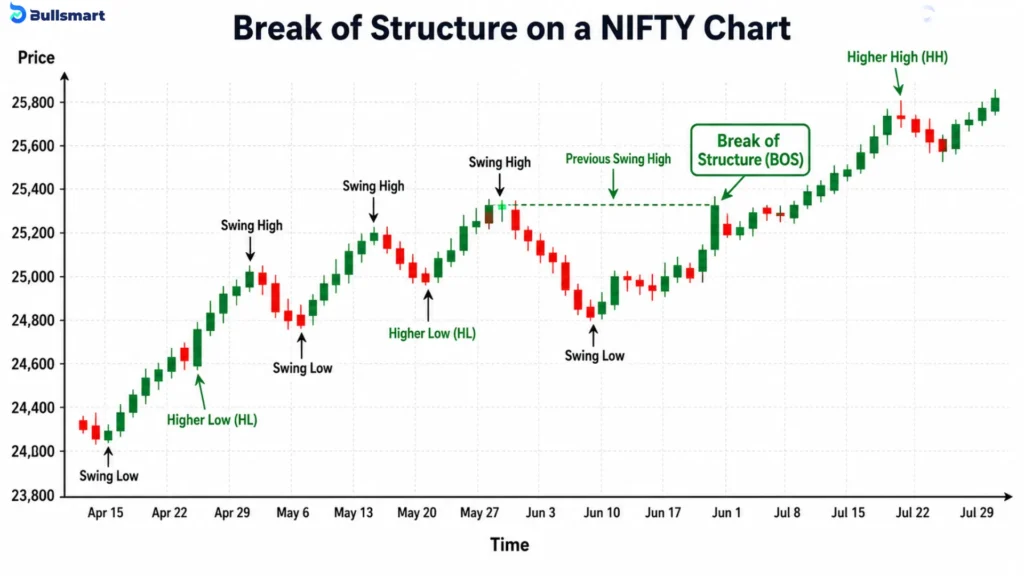
A Break of Structure, or BOS, occurs when price moves beyond an important swing point in the direction of the existing trend.
For example:
- In an uptrend, price moving above a previous swing high may be treated as a bullish BOS.
- In a downtrend, price moving below a previous swing low may be treated as a bearish BOS.
A BOS may suggest that the current trend is continuing. However, traders should clearly decide whether the break requires a candle close or whether a wick beyond the level is enough.
3. Change of Character and Market Structure Shift
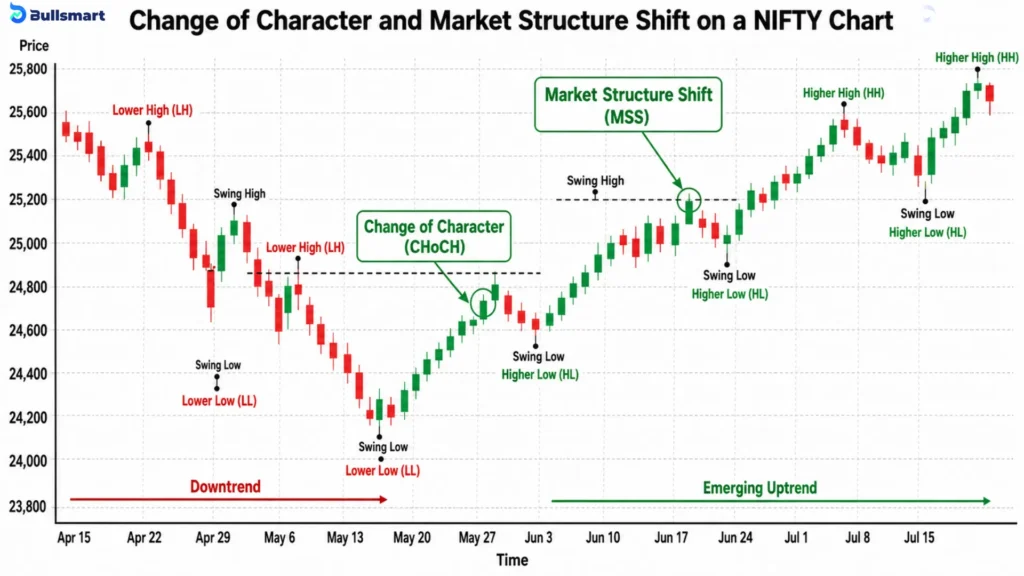
A Change of Character, or CHoCH, and a Market Structure Shift, or MSS, refer to a break against the previous market structure.
For example:
- In an uptrend, price breaking below an important higher low may suggest weakening bullish momentum.
- In a downtrend, price breaking above an important lower high may suggest weakening bearish momentum.
These terms may indicate an early change in market behaviour, but they do not confirm that a complete trend reversal will follow.
4. Displacement and Imbalance
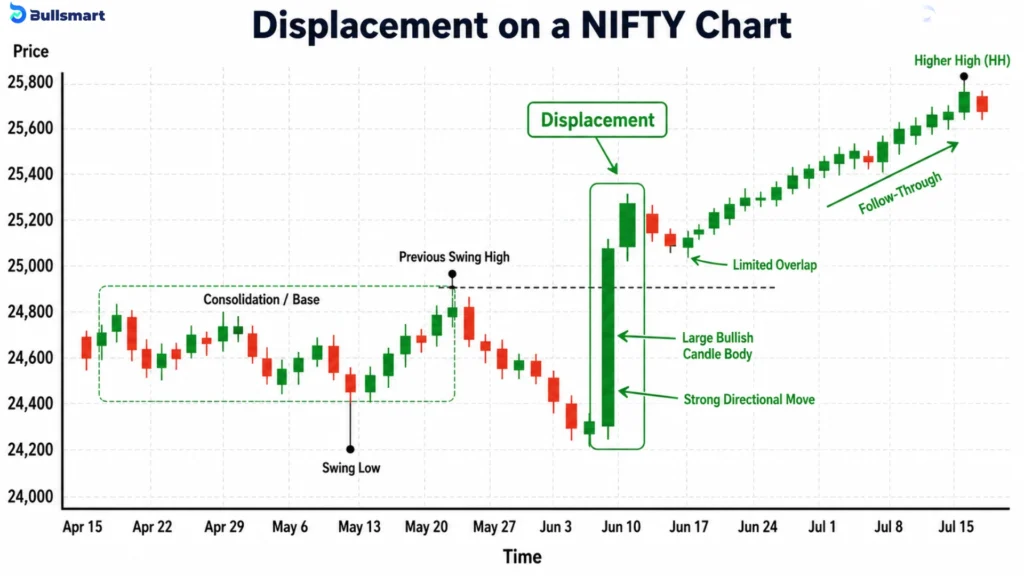
Displacement is a strong and quick price move in one direction.
It may include:
- Large candle bodies
- Limited overlap between candles
- A move beyond an important price level
- Continued movement after the break
- Little sideways movement during the move
Such movement may create an imbalance, which is a broader term for a price area formed when buying and selling activity appears uneven.
A Fair Value Gap is one specific three-candle pattern that may form during an imbalance. However, not every imbalance creates a valid FVG.
5. Liquidity and Liquidity Sweeps
In formal market terms, liquidity means how easily an order can be executed without causing a major price change.
It depends on:
- Market depth
- Available buy and sell orders
- Order size
NSE uses impact cost as one way of measuring liquidity.
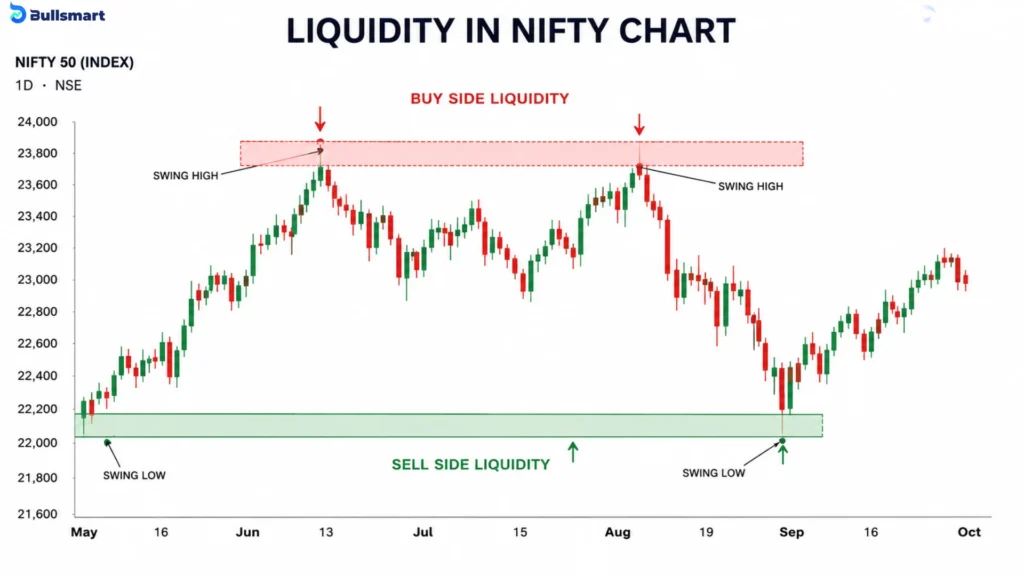
In SMC, liquidity may also refer to areas near visible highs and lows where stop-loss or pending orders may be concentrated.
A liquidity sweep occurs when price briefly moves beyond such a level and then returns.
For example:
- Price moves above a previous high and falls back.
- Price moves below a previous low and rises again.
A chart can show that the level was crossed and rejected. It cannot confirm that institutions deliberately targeted the orders placed there.
6. Order Blocks
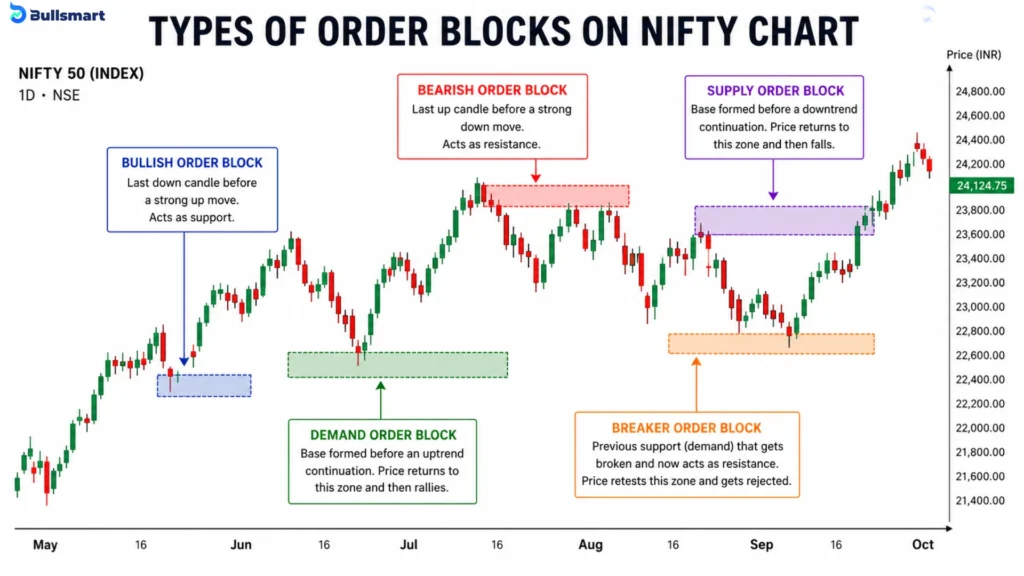
An order block is a price zone near the starting point of a strong directional move.
It is commonly identified as the final candle moving against the direction of the move that follows.
Bullish Order Block
A bullish order block is usually the last bearish candle before a strong upward move.
A stronger bullish candidate may be followed by:
- Clear upward displacement
- A close above an important swing high
- Continued upward movement
If price later returns, traders may study the zone as possible support.
Bearish Order Block
A bearish order block is usually the last bullish candle before a strong downward move.
A stronger bearish candidate may be followed by:
- Clear downward displacement
- A close below an important swing low
- Continued downward movement
If price returns, traders may study the zone as possible resistance.
Order blocks are often marked using the full candle range, although some traders use only the candle body or a smaller part of the candle.
Supply and demand zones follow a similar idea but may cover a wider consolidation area. An order block usually focuses on one specific opposing candle.
An order block remains a chart-based reference. It does not prove that institutional orders were placed or remain at that exact level.
7. Fair Value Gaps
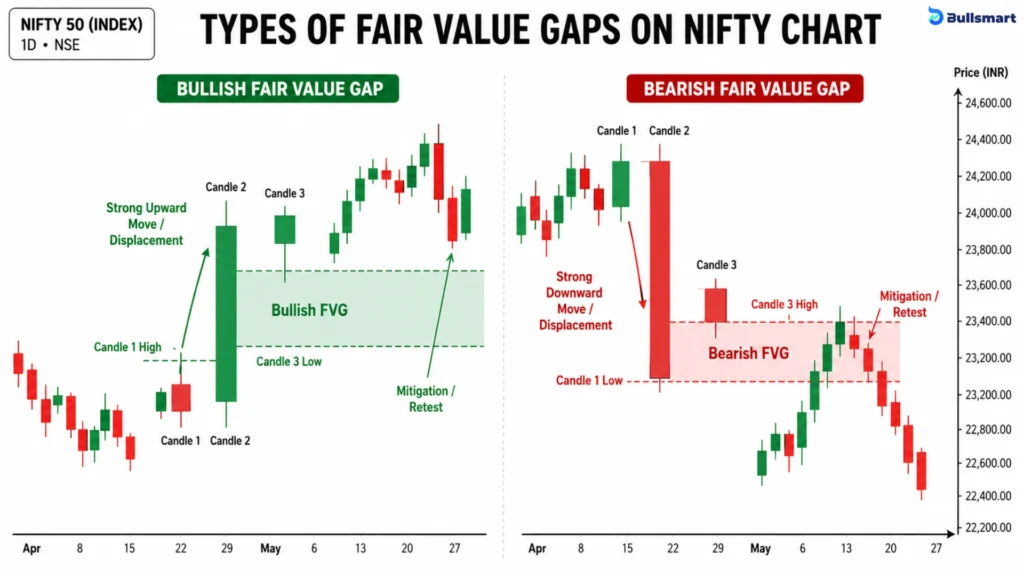
A Fair Value Gap, or FVG, is a three-candle pattern formed during a rapid price move.
Bullish Fair Value Gap
A bullish FVG forms when the low of Candle 3 remains above the high of Candle 1.
Bullish FVG zone: Candle 1 high to Candle 3 low
Bearish Fair Value Gap
A bearish FVG forms when the high of Candle 3 remains below the low of Candle 1.
Bearish FVG zone: Candle 3 high to Candle 1 low
The pattern shows that Candle 1 and Candle 3 did not overlap within the marked area.
However, this does not mean that no trades occurred there. A candlestick only shows the open, high, low and close prices.
Price also does not have to return and completely fill every FVG. It may partially enter the zone, move through it, reverse before reaching it or never revisit it.
8. Premium and Discount Zones
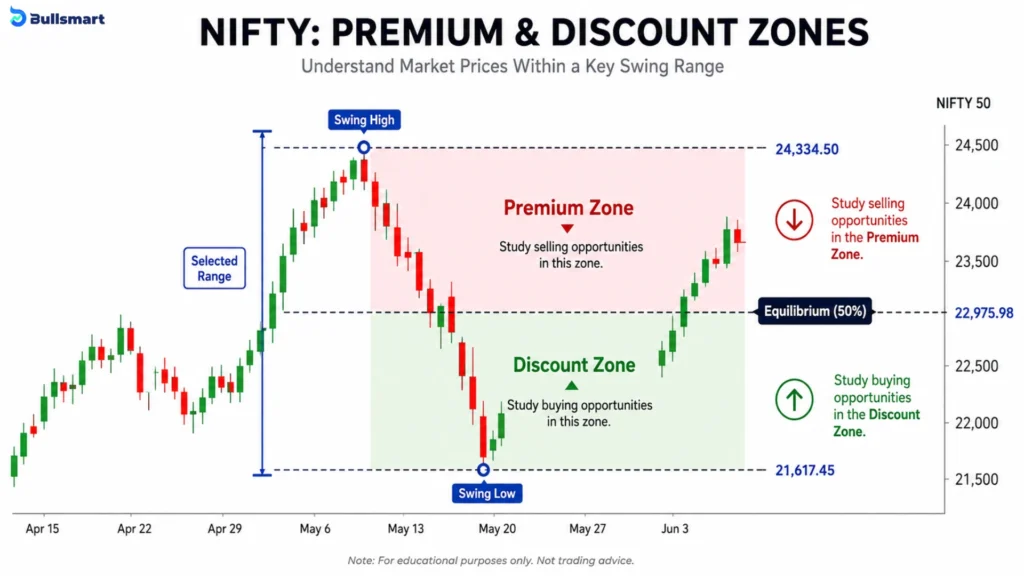
Premium and discount zones divide a selected price range around its 50% midpoint.
The range is usually measured between an important swing low and swing high.
- The area above the midpoint is called the premium zone.
- The area below the midpoint is called the discount zone.
- The midpoint is sometimes called the equilibrium level.
In SMC, traders may study the discount area during a bullish structure and the premium area during a bearish structure.
These terms do not mean that an instrument is fundamentally cheap or expensive. They only describe where price is located within the selected chart range.
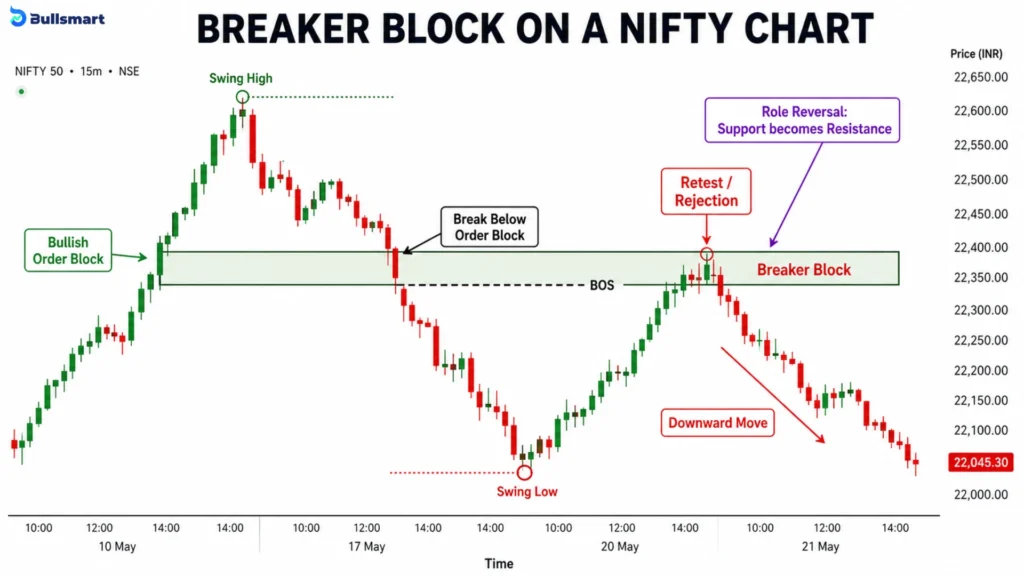
9. Breaker Block
A breaker block is an order block that fails to hold price and may later act in the opposite way.
For example:
- A bullish order block may fail when price closes below it. If price returns, the zone may be studied as possible resistance.
- A bearish order block may fail when price closes above it. If price returns, the zone may be studied as possible support.
The main idea is a possible role reversal after the original block fails.
A breaker block is still only an area for further analysis. It does not guarantee that price will react when it returns.
10. Inducement
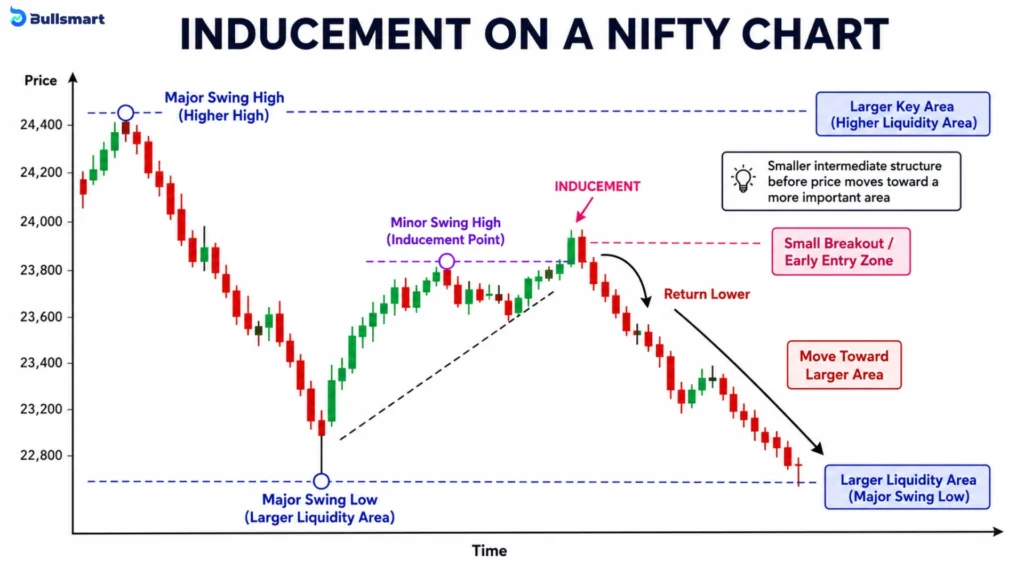
Inducement is an SMC term used for a smaller price level or apparent setup that may attract early entries before price moves towards another important area.
It may appear as:
- A minor swing high or swing low
- A small breakout
- A nearby support or resistance level
- An early entry zone
Some SMC traders interpret inducement as a structure that attracts orders before a larger move.
However, a chart cannot prove that traders were deliberately trapped. It is safer to treat inducement as a smaller intermediate structure rather than confirmed market manipulation.
11. Mitigation Block
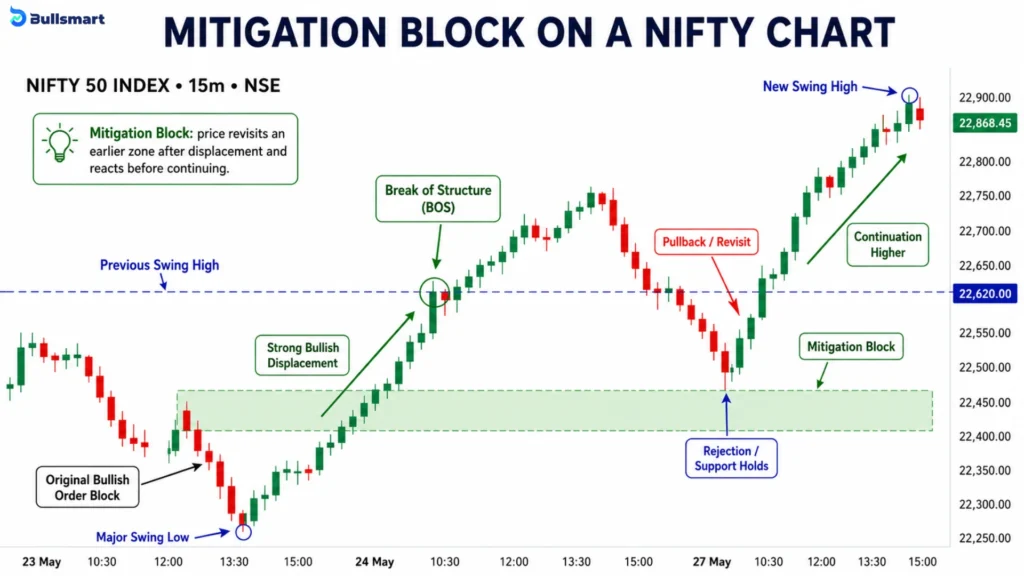
A mitigation block is a practitioner-defined zone linked to price returning to an earlier area after a structural move.
Its meaning differs across SMC methods. It may refer to:
- A previously tested order block
- A zone revisited after displacement
- A candle formed before price continues
- An area monitored after a change in structure
A mitigation block should not be confused with FVG mitigation, which simply means that price has returned to a Fair Value Gap.
Because the term has no single accepted definition, it should only be used when its formation, boundaries and invalidation rules are clearly stated.
How to Analyse Order Blocks and Fair Value Gaps
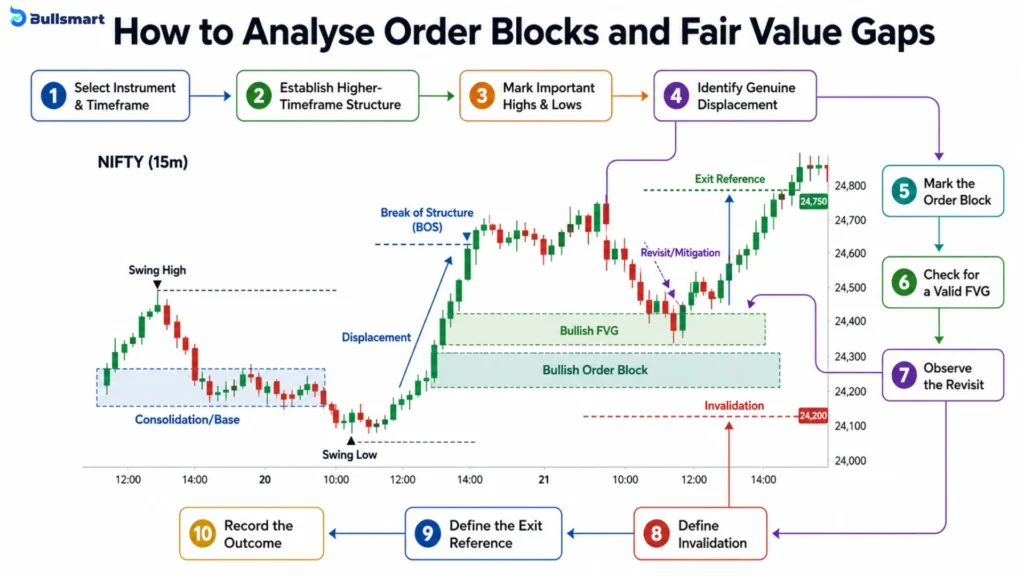
1. Select the instrument and timeframe
Begin with an instrument that has reliable chart data and sufficient trading activity. Decide whether the analysis applies to a cash share, futures contract or another segment.
The zone should be marked on the same market being evaluated. Related instruments can have different prices, gaps and expiry effects.
2. Establish the higher-timeframe structure
Mark the major swing highs and lows. Classify the broader market as:
- Upward trending
- Downward trending
- Consolidating
This provides context before smaller zones are added.
3. Mark important highs and lows
Identify earlier swing points, range boundaries and repeatedly tested levels. These are areas where trading interest may increase.
They should not automatically be called stop hunts or liquidity grabs. A standard chart shows price behaviour but does not reveal the intention behind each order.
4. Identify genuine displacement
A large candle alone is insufficient. Check whether the move:
- Closes beyond a meaningful structural level
- Has limited overlap with nearby candles
- Receives follow-through
- Moves decisively away from the originating range
5. Mark the order block
Locate the last opposing candle before the displacement. Apply one fixed boundary rule and keep it unchanged throughout the analysis.
6. Check for a valid FVG
Apply the three-candle formula objectively.
For a bullish FVG: Candle 3 low > Candle 1 high
For a bearish FVG: Candle 3 high < Candle 1 low
A large middle candle without the required non-overlap is not an FVG.
7. Observe the revisit
A return to the zone is not an automatic entry signal. Note whether price:
- Rejects the area
- Closes through it
- Forms a lower-timeframe structural change
- Remains directionless inside the zone
8. Define invalidation
Set the invalidation rule before judging the outcome. It may be:
- A close beyond the order block
- Complete failure of the FVG
- A break of the structural swing supporting the setup
9. Define the exit reference
Possible reference points include an earlier swing, a range boundary or an opposing zone. These are analytical levels, not assured targets.
10. Record the outcome
Log the instrument, timeframe, zone boundaries, entry condition, invalidation, transaction costs and result. Recording failed zones as well as successful ones reduces hindsight bias and discourages redrawing levels after the event.
Applying SMC to Indian Markets
Do Not Confuse an Opening Gap with an FVG
An opening gap and a fair value gap are not the same thing.
NSE’s equity pre-open session runs from 9:00 a.m. to 9:15 a.m. During this period, orders are collected and matched before regular trading begins. The opening price is based on demand and supply, with preference given to the price at which the highest quantity of shares can be traded.
This means an overnight gap may appear because of new information, global market movements or orders placed before the regular session. It should not automatically be marked as an FVG. A fair value gap follows a specific three-candle structure, while an opening gap forms between two trading sessions.
Account for Corporate Actions
Corporate actions can change how historical prices appear on a chart.
Events such as:
- Bonus issues
- Stock splits
- Share consolidations
- Mergers or other adjustments
may alter past price levels. In derivatives, these events can also affect strike prices, open positions and market lots.
Before marking an old order block or FVG, check whether a corporate action occurred around that date. Using an adjusted chart can help prevent inaccurate zones.
Check the Instrument’s Liquidity
Liquidity can vary significantly from one security to another.
A highly traded instrument usually has better market depth and narrower spreads. A thinly traded security may show sudden candles, wider spreads and sharper price movements because fewer orders are available.
Such movements may look like displacement or create apparent SMC zones, but they may simply be the result of low liquidity.
Cash and futures charts should also be analysed separately. Futures may trade above or below the underlying cash price. Continuous futures charts can also show artificial jumps when one contract expires and the next contract is added.
Common SMC Analysis Mistakes
SMC analysis can become unreliable when traders use unclear rules or adjust their markings after seeing the result. Here are some common mistakes and why they matter:
1. Marking Every Opposing Candle as an Order Block
Not every bearish candle before an upward move or bullish candle before a downward move is a valid order block.
Without clear displacement or a break of structure, the candle may simply be part of normal market movement.
2. Calling Every Strong Three-Candle Move an FVG
A strong middle candle alone does not create a fair value gap.
Candle 1 and Candle 3 must have a clear non-overlapping price area. Ignoring this rule can lead to incorrect FVG markings.
3. Selecting Zones After Price Has Reacted
Marking a zone only after seeing a successful reaction creates hindsight bias.
It may make the method appear more accurate than it actually is because failed or unclear zones are often ignored.
4. Changing Zone Boundaries After a Failure
Moving or narrowing a zone after price crosses it changes the original rules.
This makes proper testing difficult because the setup is adjusted to match the result.
5. Ignoring Higher-Timeframe Structure
A zone may appear strong on a smaller timeframe but may be moving against the broader trend.
Checking the higher timeframe provides context and helps filter weaker zones.
6. Treating All Liquidity as Stop-Loss Liquidity
Liquidity includes available buy and sell orders, market depth and the ability to execute trades.
It does not refer only to stop-loss orders placed above highs or below lows.
7. Assuming a Reaction Proves Institutional Activity
Price reacting from an order block or FVG does not reveal who placed the orders.
The reaction may result from several market factors, so it should not be treated as proof of institutional buying or selling.
8. Using Very Low Timeframes Without Considering Noise
Lower timeframes contain more frequent and less meaningful price movements.
This can produce many apparent order blocks, FVGs and structure breaks that may not remain relevant.
9. Ignoring Trading Costs
Brokerage, statutory charges, spreads, slippage and impact cost can reduce the actual result of a trade.
A setup that appears profitable on a chart may not remain profitable after all costs are included.
10. Entering Only Because Price Touches a Zone
A touch does not confirm that the zone will hold.
Price may reject the area, move sideways or pass directly through it. Traders may therefore study confirmation, structure and invalidation before considering an entry.
Why Marking Too Many Zones Is a Problem
When almost every candle or price area is marked, nearly any future movement can be linked to an earlier zone.
This makes the framework difficult to test or disprove. A more consistent approach is to use fixed conditions, mark only qualifying zones and record both successful and failed outcomes.
How to Test SMC Objectively
SMC should be tested using fixed rules rather than selected chart examples.
Before reviewing past results, clearly decide:
- Which instrument and timeframe will be tested
- What qualifies as displacement
- How an order block will be marked
- Which formula will define an FVG
- What will count as mitigation
- What will trigger an entry
- When the setup will become invalid
- How the exit level will be selected
These rules should remain the same throughout the test. Changing them after seeing the result can make the framework appear more successful than it actually is.
The test should also include:
- Transaction costs: Brokerage, taxes and other charges can reduce the final return.
- Successful and failed zones: Recording only successful setups creates an incomplete picture.
- Maximum favourable movement: This shows how far price moved in the expected direction.
- Maximum adverse movement: This shows how far price moved against the setup.
- Slippage assumptions: The actual execution price may differ from the expected price.
- A comparison method: Results can be compared with a simpler approach to check whether SMC filters add value.
For example, traders can compare SMC-based results with all qualifying breaks of structure that do not use order blocks or FVGs. This helps show whether the additional conditions improve the outcome.
Objective testing is especially important in derivatives. A SEBI study published in July 2025 found that ~91% of individual equity-derivative traders incurred net losses in FY25. Their combined net losses after transaction costs reached Rs. 1,05,603 crore.
The study did not examine SMC specifically. However, it highlights why no chart-based framework should replace position sizing, cost control and clearly defined risk limits.
Bottom Line
Smart Money Concepts can make a chart feel less like a wall of candles and more like a story with structure. Order blocks, fair value gaps, liquidity zones and market shifts help traders notice where price moved with force, where it may pause, and which areas deserve a second look.
But the chart still has limits. It cannot reveal exactly who placed an order, prove that institutions are waiting at a level, or promise that a zone will hold. That is where discipline matters more than labels.
The strongest SMC analysis comes from using clear rules, marking zones consistently and checking the bigger market structure before focusing on smaller signals. It also means accounting for trading costs, liquidity, corporate actions and the differences between cash and futures charts.
Most importantly, do not judge SMC only by the clean examples that worked. Record the failed zones too. Test the rules, compare the results and define risk before entering.
Used this way, SMC becomes more than chart vocabulary. It becomes a practical framework for reading price with greater clarity, patience and control.
Disclaimer: This blog is intended only for educational and informational purposes. Smart Money Concepts, order blocks, fair value gaps and related chart patterns are practitioner-defined tools and do not guarantee any trading outcome. The examples and explanations should not be treated as investment advice, trading recommendations or confirmed evidence of institutional activity. Market conditions can change, and trading involves the risk of loss. Readers should conduct independent research, consider transaction costs and risk limits, and consult a SEBI-registered investment adviser where appropriate before making financial decisions.
FAQs
Which is better, SMC or ICT?
Neither is automatically better. ICT is a broader trading methodology that includes concepts such as liquidity, order blocks, fair value gaps and market structure. SMC is a general framework that uses many similar ideas. The better choice depends on which approach you understand, can define clearly and test consistently rather than which one appears more advanced.
Are Smart Money Concepts profitable?
Smart Money Concepts may support profitable trading, but profitability is not guaranteed. Results depend on the trader’s rules, market conditions, risk management, execution and trading costs. Order blocks and fair value gaps should be tested using fixed definitions. Looking only at successful chart examples can make the method appear more reliable than it actually is.
Does SMC trading really work?
SMC can work as a structured method for studying price behaviour, market structure and possible reaction zones. However, its concepts do not directly reveal institutional orders or guarantee price reactions. Whether it works for a trader can only be assessed through objective testing, consistent execution and complete records of both successful and failed setups.
Which SMC indicator is best?
There is no single best SMC indicator. Indicators may automatically mark order blocks, fair value gaps, structure breaks or liquidity zones, but their rules can differ. A useful indicator should have transparent and adjustable settings and should not overcrowd the chart. Traders should understand how it identifies each zone before relying on its signals.