
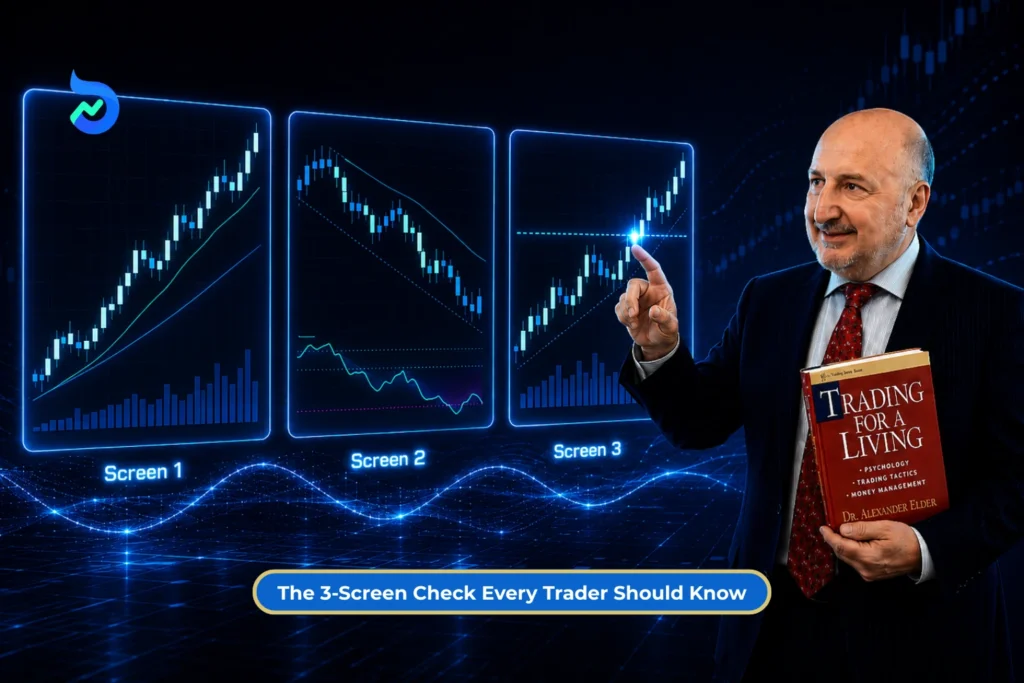
A price chart can look bullish and bearish at the same time. The weekly trend may be moving higher, the daily chart may be correcting, and the intraday chart may be heading in a completely different direction.
Indicators can create the same kind of confusion. Trend-following indicators are designed to track directional movement, while oscillators focus more on shorter-term extremes and possible turning points. So, expecting every indicator to confirm the same view is not always useful.
Alexander Elder developed the Triple Screen Trading System to deal with this conflict. Elder states that he had been using the system since 1985 and first presented it publicly in an April 1986 article in Futures Magazine.
The system uses three separate screens. The first identifies the dominant trend, the second looks for a countertrend setup, and the third helps determine how to enter.
In this blog, we will break down all three screens in simple terms and explain how they work together to create a more structured way of analysing a trade.
What Is Elder’s Triple Screen Trading System?
Elder’s Triple Screen system is a multi-timeframe technical analysis framework combining trend-following analysis, oscillators and execution rules.
Elder connected this structure with the older market metaphor of tide, wave and ripple, which he credited to market technician Robert Rhea. The tide represents the larger trend, the wave the intermediate movement and the ripple short-term price action.
Triple Screen starts with the largest relevant timeframe and works downward. The higher timeframe decides which side of the market the system is willing to consider. Elder’s later explanation describes Screen 1 as the strategic decision, Screen 2 as the tactical setup and Screen 3 as the method used to place the trade.
Who Is Dr. Alexander Elder?
Dr. Alexander Elder is a professional trader, author, trading educator and former psychiatrist. He is best known for combining technical analysis with trading psychology and risk management.
Quick Profile
| Born | 1950, Leningrad, Soviet Union |
| Early Career | Doctor and psychiatrist |
| Academic Background | Served on the faculty of Columbia University |
| Known For | Trading psychology, technical analysis and risk management |
| Trading Systems & Indicators | Triple Screen Trading System, Force Index, Elder Impulse System |
| Popular Books | Trading for a Living, Come Into My Trading Room, The New Trading for a Living |
From Medicine to Markets
Elder entered medical school at just 16 and later worked as a doctor aboard a Soviet ship. At 23, while the ship was in Africa, he left and eventually received political asylum in the United States.
After settling in the US, Elder worked as a psychiatrist in New York and also taught at Columbia University.
His background in psychiatry later became an important part of his trading work. Elder was interested not only in what prices were doing, but also in how traders behave when money, fear, greed and uncertainty are involved.
His Main Areas of Expertise
Elder’s work mainly covers four areas:
- Technical analysis: Studying trends, momentum and price behaviour through charts and indicators.
- Trading psychology: Understanding how emotions and discipline affect trading decisions.
- Risk management: Focusing on position sizing, stop-losses and controlling the amount of capital exposed to a trade.
- Trading systems: Developing structured methods that combine different types of market analysis.
This is also where the Triple Screen Trading System fits in. Elder designed it to deal with conflicting signals across indicators and timeframes.
His Work as an Author and Educator
Elder became widely known after the publication of Trading for a Living in 1993. He later wrote books including Come Into My Trading Room and The New Trading for a Living.
He also founded Financial Trading Seminars, later developed trading camps and became involved in the SpikeTrade trading community.
What makes Elder’s work distinctive is the mix of three subjects that are often discussed separately: charts, psychology and risk. His approach treats all three as connected parts of the trading process.

The Three Screens in Elder’s Triple Screen System
The Triple Screen System checks the market in three steps. Each screen uses a different timeframe and answers a different question. The system starts with the bigger trend and then moves down to the entry level.
Screen 1: Identify the Main Trend
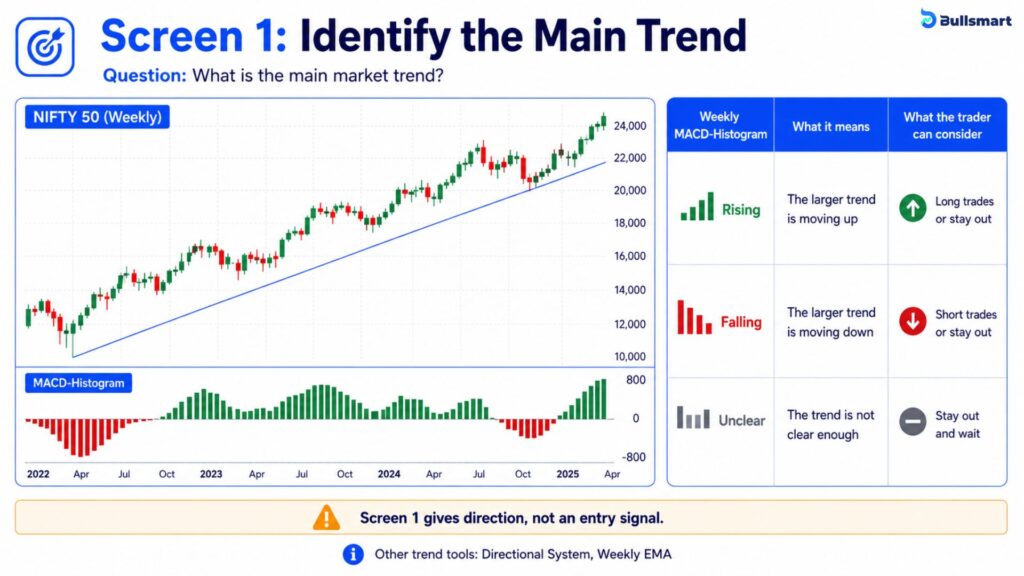
Screen 1 answers one question: What is the main market trend?
In Elder’s original Triple Screen System, he used the weekly MACD-Histogram for this.
He compared the two latest histogram bars:
| Weekly MACD-Histogram | What it means | What the trader can consider |
| Rising | The larger trend is moving up | Long trades or stay out |
| Falling | The larger trend is moving down | Short trades or stay out |
| Unclear / no strong direction | The trend is not clear enough | Stay out and wait |
Caution: Screen 1 does not give an entry signal. It simply tells the trader which direction to focus on.
Does Screen 1 always use MACD-Histogram?
No. Elder explained that other trend-following indicators can also be used.
These include:
- Directional System: A trend-following tool that uses directional movement to show whether buyers or sellers are stronger.
- Slope of a weekly EMA: It checks whether the weekly EMA is rising or falling to show the broader trend direction.
In his later work, Elder himself preferred using the slope of a weekly EMA to judge the larger trend, while still keeping the weekly MACD-Histogram on the chart.
So, the exact indicator can change. What does not change is the purpose of Screen 1: identify the bigger trend and decide which direction to trade.
Screen 2: Wait for the Move Against the Trend
Once Screen 1 finds the main trend, Screen 2 looks at the intermediate timeframe.
Its job is to find a short-term move in the opposite direction.
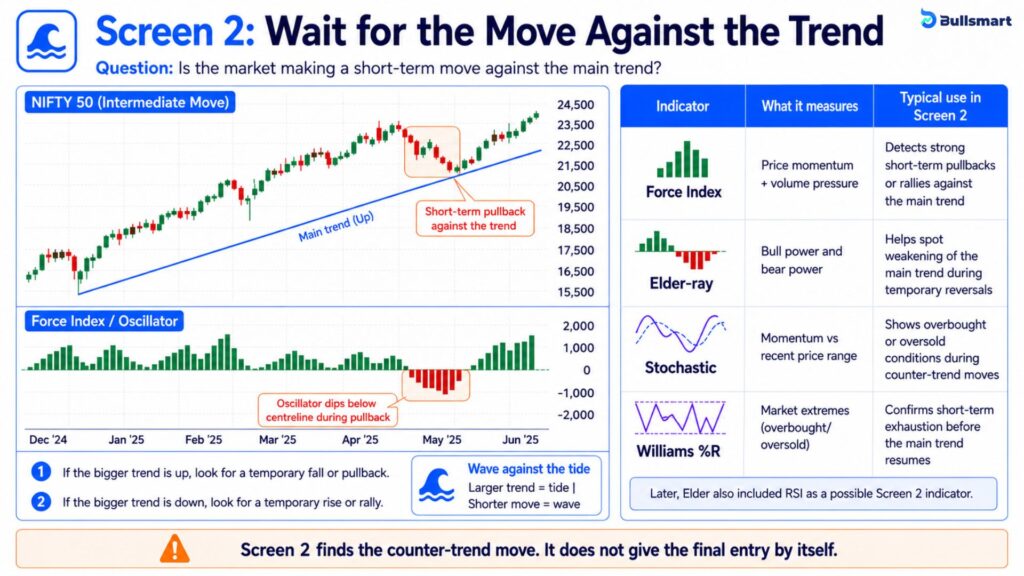
- If the bigger trend is up, Screen 2 looks for a temporary fall or pullback.
- If the bigger trend is down, Screen 2 looks for a temporary rise or rally.
Elder described this as a wave moving against the tide. The larger trend is the tide, while the shorter move is the wave.
Which indicators are used in Screen 2?
Screen 2 mainly uses oscillators, because they help spot short-term moves against the bigger trend.
In his original work, Elder discussed indicators such as:
| Indicator | Definition | Aspect Measured | Typical Situation in Screen 2 |
| Force Index | Measures the strength of price moves by combining price change and volume. | Price momentum + volume pressure | Used to detect strong short-term pullbacks or rallies against the main trend. |
| Elder-ray | Shows buying and selling pressure by comparing highs/lows to a moving average. | Bull power and bear power | Helps identify weakening of the main trend and entry points during temporary reversals. |
| Stochastic | Indicates momentum by comparing closing price to its recent price range. | Momentum relative to recent range | Used to spot overbought or oversold conditions during counter-trend moves. |
| Williams %R | Measures overbought or oversold levels based on the close relative to the high-low range. | Market extremes (overbought/oversold) | Helps confirm short-term exhaustion in the counter-trend move before continuation of main trend. |
For example, if the weekly MACD-Histogram is rising, a 2-day EMA of the Force Index moving below its centreline can show a short-term pullback within the larger uptrend.
If the weekly trend is falling, the Force Index moving above its centreline can point to a temporary rally within that larger downtrend.
Elder’s choice of indicators also changed over time. In his earlier work, he considered RSI too slow for Triple Screen. Later, in Come Into My Trading Room, he included Relative Strength Index (RSI) as one of the indicators that could be used for Screen 2.
So, just like Screen 1, Screen 2 is not tied to one fixed indicator. Its main job is to find a short-term move against the larger trend.
Screen 3: Check the Entry
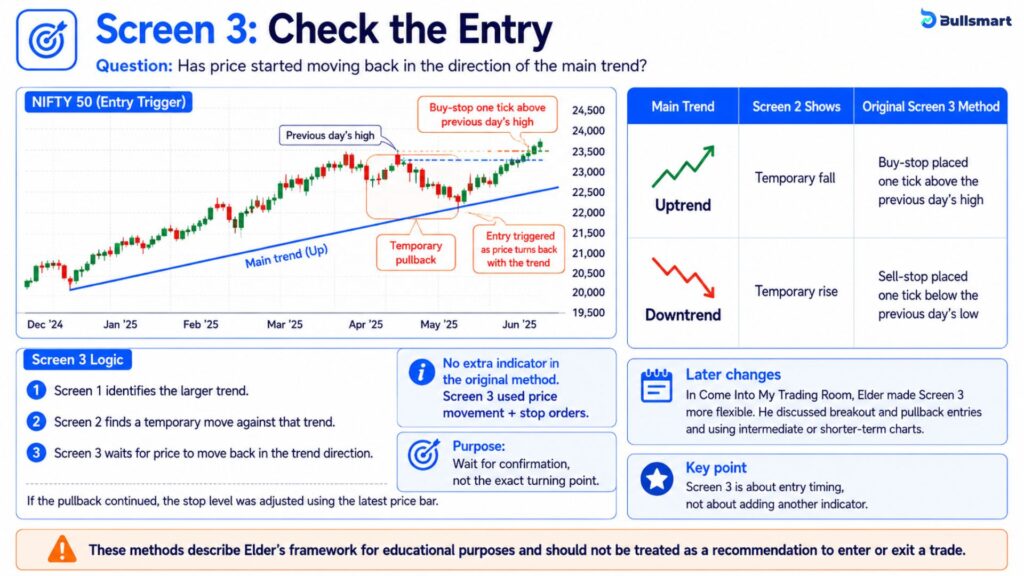
Screen 3 asks one simple question: Has price started moving back in the direction of the main trend?
Screen 1 finds the bigger trend. Screen 2 looks for a temporary move against that trend. Screen 3 then checks whether that temporary move may be ending.
What Did Elder Use in Screen 3?
In the original Triple Screen System, Elder did not use another indicator for Screen 3.
He used price movement and stop orders.
| Main Trend | Screen 2 Shows | Original Screen 3 Method |
| Uptrend | Temporary fall | Buy-stop placed one tick above the previous day’s high |
| Downtrend | Temporary rise | Sell-stop placed one tick below the previous day’s low |
If the temporary move continued, the stop level was adjusted using the latest price bar.
What Was the Purpose?
The purpose was not to guess the exact turning point.
Screen 3 waited for price to show some movement back in the direction of the larger trend before the order could be triggered.
Did Elder Change Screen 3 Later?
Yes. In Come Into My Trading Room, Elder made Screen 3 more flexible. He discussed other entry methods, including breakout and pullback approaches, and said that intermediate or shorter-term charts could be used.
The key point is that Screen 3 is about entry timing, not about adding another indicator.
These methods describe Elder’s framework for educational purposes and should not be treated as a recommendation to enter or exit a trade.
Why Did Elder Use Three Screens Instead of One Indicator?
Elder used three screens because one chart or one indicator may not show the full picture.
1. Different indicators can say different things
A trend indicator may show that the market is still moving up. At the same time, an oscillator may show that price has moved too far up and could pull back.
So, which one should you follow?
Elder believed that simply using more indicators and following the majority was not a good solution. If most of those indicators work in the same way, they may just be repeating the same signal.
Instead, he gave different indicators different jobs.
2. The trend can look different on different timeframes
A stock can be moving up on a daily chart but moving down on a weekly chart. Both can be correct because they are looking at different periods.
So, the screens do not need to agree all the time. In fact, Screen 2 is meant to look for a move in the opposite direction before Screen 3 looks for an entry.
Choosing the Three Timeframes: Elder’s Factor of Five
Elder does not prescribe one universal weekly, daily and hourly combination. He begins with the intermediate timeframe, meaning the timeframe normally used for trading.
The longer timeframe is roughly five times longer. In the original framework, the shorter timeframe is roughly five times shorter.
For multi-day trading, Elder gives daily charts as the intermediate timeframe, weekly charts as the long-term screen and hourly charts as the short-term screen. For short intraday trading, he gives a 10-minute intermediate chart, an hourly long-term chart and a 2-minute short-term chart.
| Trading Horizon | Screen 1 | Screen 2 | Screen 3 |
| Multi-day or swing | Weekly | Daily | Hourly |
| Short intraday | Hourly | 10-minute | 2-minute |
The factor of five is approximate, not an exact mathematical requirement. In Come Into My Trading Room, Elder explicitly says rounding is acceptable. His later presentation also makes Screen 3 more flexible, allowing it to be implemented on the intermediate or shorter timeframe depending on the entry method.
This is an important distinction behind the term “three-timeframe system.” Triple Screen fundamentally requires three tests, but the third test does not always require a completely separate chart.
The Complete Triple Screen Checklist
- Choose the intermediate trading timeframe.
- Move roughly one factor of five higher.
- Identify the dominant trend with a trend-following method.
- Consider trades only in that direction, or stand aside.
- Return to the intermediate timeframe.
- Use an oscillator to identify a countertrend move.
- Wait for an entry trigger back in the dominant direction.
- Define the stop, position risk and exit logic before execution.
- Reject the setup if the required conditions disappear.
Elder’s original directional logic can be summarised as follows:
| Long-Term Trend | Intermediate Move | Action |
| Up | Up | Stand aside |
| Up | Down | Look for a long entry |
| Down | Down | Stand aside |
| Down | Up | Look for a short entry |
Notice what the table does not say. An uptrend on both timeframes is not automatically a Triple Screen long setup. The method specifically searches for a pullback against the dominant trend before moving to the entry stage.
Risk Management in Elder’s Triple Screen System
The triple screen system does not end once an entry is found. Elder also included rules for managing risk after a trade is taken.
A Valid Setup Can Still Lose
Passing all three screens does not mean a trade will be profitable.
In Elder’s 1993 example using gold, one Triple Screen trade was stopped out. This shows that even when the trend, setup and entry conditions line up, the trade can still fail.
Stop-Losses Are Part of the System
Elder paired Triple Screen with protective stop-loss rules.
In his later work, he explained that stops should generally be placed:
- Outside normal market noise
- At a level that limits the planned loss
- In a way that they are moved only in the direction of the trade
He also stressed that stop levels and profit targets should be thought about before moving to short-term execution.
Suggested Read: 2 Powerful Fibonacci Levels Explained: Fibonacci Retracement vs Fibonacci Extension
Position Size Matters Too
Elder also used a 2% account-equity risk rule in his money-management framework.
Under this rule, the planned loss on a trade should not exceed 2% of the trading account. If the required stop would create a larger risk, Elder’s rule was to skip that trade.
However, 2% is Elder’s own rule. It should not be treated as a universal or ideal risk level for every trader.
The Main Point
Triple Screen separates four different things:
- Direction: What is the larger trend?
- Setup: Is there a move against that trend?
- Entry: Has price started moving with the trend again?
- Risk: How much could be lost if the trade does not work?
A trade can meet all the technical conditions and still lose money. That is why Elder treated risk control as a separate part of the trading process.
Suggested Read: 4 Powerful XABCD Harmonic Patterns Explained: Master Gartley, Butterfly, Bat & Crab
Risk Management in Elder’s Triple Screen System
The Triple Screen System does not stop once an entry is found. Elder also talks about what happens if the trade does not go as expected.
And that matters because a trade can pass all three screens and still lose money.
In Elder’s 1993 gold example, one Triple Screen trade was stopped out. So, even if the trend, setup and entry all line up, there is still no guarantee that the trade will work.
Stop-Losses Are Part of the Process
Elder paired the system with protective stop-loss rules.
In his later work, he explained that stops should be placed outside normal market noise and moved only in the direction of the trade. He also said that stop levels and profit targets should be thought about before moving to short-term execution.
In simple terms, the entry is only one part of the decision. The possible loss also needs to be considered before the trade is taken.
What About the 2% Rule?
Elder also used a 2% account-equity risk limit in his money-management framework.
Under his rule, if the planned stop could lead to a loss of more than 2% of the account, the trade would be skipped.
But this is important: 2% is Elder’s own rule. It is not a universal risk level that suits everyone.
The broader idea is much simpler. Finding the trend, spotting the setup and timing the entry are separate from deciding how much money is at risk.
A trade can look technically correct and still fail. That is why risk management remains a separate part of the Triple Screen framework.
Suggested Read: 11 Smart Money Concepts for Indian Traders for a Practical Analysis Framework
Does the Triple Screen System Actually Work?
There is no reliable universal win rate for the Triple Screen System.
One reason is that Triple Screen is not a single fixed strategy. Elder allows traders to use different trend indicators, different oscillators and different entry methods. His later versions of the system also made Screen 3 more flexible.
So, two people using “Triple Screen” may actually be testing very different rule sets.
That is why claims such as “Triple Screen has a 70% win rate” can be misleading unless the exact setup is explained.
What Does the Research Say?
There has been some research on the system, but the results need to be read carefully.
A 2012 master’s thesis tested a Triple Screen-based approach on 222 stocks from the Taiwan 50 Index and Taiwan Mid-Cap 100 Index. The study used data from 2005 to 2011.
In the versions tested, the researchers reported fewer trades and better profitability after transaction costs were included.
However, that does not prove that Triple Screen will produce the same results everywhere.
The study covered:
- One market
- One historical period
- One specific version of the system
So, What Can We Take From This?
Triple Screen is better understood as a framework that can be tested, rather than a system with one fixed success rate.
Any performance claim should explain exactly what was tested, including:
- Indicators used
- Indicator settings
- Timeframes
- Market
- Entry rules
- Transaction costs
- Testing period
Without these details, a win rate or accuracy figure does not tell you much.
Advantages and Limitations of the Triple Screen System
The Triple Screen System gives each screen a specific job. This can make the analysis more organised, but it also adds more steps and depends heavily on how the system is set up.
| Screen | Scenario | Potential Strength | Limitation |
| Screen 1 | Short-term price is moving against the bigger trend | Checks the higher-timeframe trend first, so short-term moves are viewed in context. | Requires checking multiple timeframes, which takes more time. |
| Screen 1 & 2 | Different indicators are giving different signals | Gives different indicators different jobs instead of asking them all to agree. | Indicator choices are not fixed, so results can vary. |
| Screen 2 | Price temporarily moves against the main trend | Helps identify a pullback or rally within the larger trend. | Strong trends may have very small or few pullbacks. |
| Screen 3 | A setup has formed and entry timing needs to be checked | Separates entry timing from trend and setup analysis. | Even a valid entry can fail because of market noise or changing conditions. |
| All 3 Screens | The system is used across different trading styles | Timeframes can be adjusted for swing, intraday or shorter-term analysis. | Results depend on the market, timeframe, indicators and settings used. |
| All 3 Screens | Market conditions are unclear | Allows staying out instead of forcing a trade. | Risk controls such as stop-losses and position sizing are still required. |
More Screens Do Not Mean More Accuracy
The purpose of Triple Screen is not to keep adding indicators until most of them give the same signal.
Elder criticised this approach because several similar indicators may simply repeat the same information.
Instead, Triple Screen gives each screen a different job.
So, the system is based on separating different parts of the analysis, not on using as many indicators as possible. More screens or indicators do not automatically mean better accuracy.
Common Mistakes When Understanding Elder’s Triple Screen
- Starting with the smallest timeframe: Elder’s framework begins with the larger trend, then moves to the shorter timeframes.
- Expecting all three screens to point in the same direction: Screen 2 is actually meant to look for a temporary move against the larger trend.
- Treating Screen 1 as an entry signal: Screen 1 only shows the broader market direction. It does not decide the entry point.
- Reading an oscillator on its own: In Triple Screen, the oscillator in Screen 2 is read together with the larger trend from Screen 1.
- Using the same type of indicator on every screen: The three screens have different jobs. Using three similar trend indicators misses that basic idea.
- Treating the factor of five as an exact rule: Elder described the gap between timeframes as approximate, not fixed.
- Assuming every modern version is part of Elder’s original method: Elder changed some of his own indicators and entry methods over time.
- Ignoring risk management: Trend, setup and entry are only one part of the framework. Elder discussed stops and position sizing separately.
- Assuming three screens guarantee a successful trade: They do not. Elder’s own published example includes a Triple Screen trade that was stopped out.
These differences matter because Triple Screen is often simplified in modern explanations. Elder’s original framework was more about giving each screen a separate job than making every signal agree.
Bottom Line
Bottom Line
The Triple Screen System is not about finding three charts that all say the same thing. In fact, that is almost the opposite of what Elder was trying to do.
The whole idea is to look at the market in layers. First, understand the bigger trend. Then check whether price is moving against that trend for a while. Finally, see how Elder’s framework handled the entry.
What makes the system interesting is that each screen has a different job. One gives direction, one gives context, and one deals with execution. That helps avoid the common mistake of loading a chart with several indicators that are all saying roughly the same thing.
But Triple Screen is still only a framework. It does not promise a fixed win rate, and even a setup that checks all three boxes can fail.
So, the real lesson is not “three screens are better than one.” It is much simpler: different market questions need different tools, and each tool should have a clear job.
Disclaimer: This article is for educational and informational purposes only and should not be considered investment, trading, or financial advice. The Triple Screen System and the indicators discussed do not guarantee profitable trades or eliminate market risk. Trading in securities and derivatives involves the risk of financial loss. Readers should conduct their own research, assess their risk tolerance, and consult a SEBI-registered investment adviser or other qualified professional before making any investment or trading decisions. Past performance and historical market behaviour do not guarantee future results.
FAQs
Which screen is best for trading?
There is no single “best” screen in Elder’s system because each screen has a different job. Screen 1 identifies the main trend, Screen 2 looks for a temporary move against that trend, and Screen 3 focuses on entry timing. The system works as a sequence, so no screen is meant to replace the others.
What is a triple screen analysis?
Triple Screen analysis is a multi-timeframe way of studying the market. It starts with the larger trend, then checks for a shorter-term move against that trend, and finally looks at entry timing. The idea is to give different timeframes and indicators separate roles instead of expecting every chart or indicator to show the same signal.
What is Alexander Elder’s Triple Screen trading method?
Alexander Elder’s Triple Screen trading method is a technical analysis framework built around three tests. The first screen finds the dominant trend, the second looks for a countertrend pullback or rally, and the third checks entry timing. Elder developed the method to deal with conflicting signals across different indicators and timeframes.
Who is Alexander Elder?
Dr. Alexander Elder is a professional trader, author, trading educator and former psychiatrist. He is known for combining technical analysis with trading psychology and risk management. His best-known works include Trading for a Living and Come Into My Trading Room. He also developed tools and methods such as the Triple Screen Trading System and Force Index.