
For Indian options traders who want to stop reading labels and start reading intent.
The Assumption That’s Costing You Money
Open any options trading community in India: Telegram group, Twitter thread, YouTube comment section, and you’ll find some version of this analysis posted every morning:
“21,500 CE has highest OI. Strong resistance. 21,000 PE has highest OI. Strong support. Range for the day: 21,000 to 21,500.”
It sounds reasonable. It feels like analysis. And it’s almost entirely wrong.
Not wrong in the sense that those levels don’t matter, they do. But wrong in the deeper sense: the person reading it has no idea why that OI is there, who put it there, when it was built, or what it will do under pressure. They’ve read the label on the box without opening it.
This is the gap between option chain reading and option chain interpretation. And it’s a gap that separates the traders who consistently extract edge from this data from the majority who simply misuse it.
The NSE option chain is one of the richest publicly available datasets in Indian financial markets. Every strike, every side, every number on that screen is a record of decisions made by everyone from retail speculators to large institutional desks. The data is the same for everyone. What differs is the depth of reading.
This article is about going deeper.
What the Option Chain Actually Is
Before interpretation, clarity on the foundation.
The NSE option chain is a live snapshot of all listed options contracts for a given underlying: Nifty, Bank Nifty, or any F&O stock, across all strikes and expiries. What you see at any moment reflects the cumulative result of every trade that has occurred up to that point in the session.
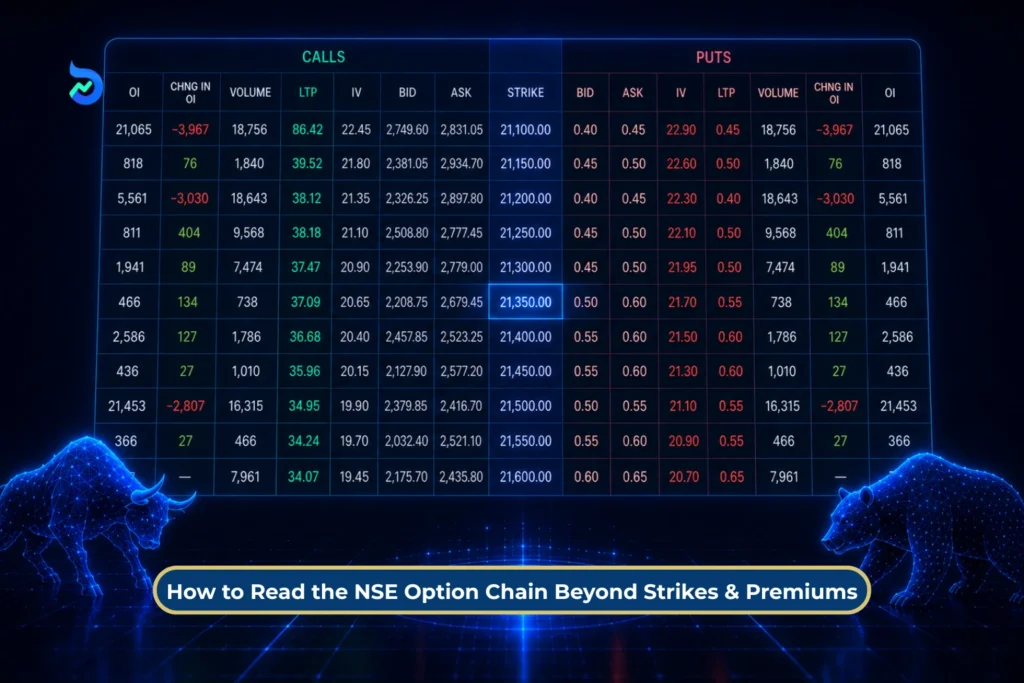
Each row in the option chain is a strike price. Each strike has two sides: calls on the left, puts on the right.
Every number you see in that grid is a compressed piece of market behavior: how much is sitting open, how much changed today, how much has been traded, what the bid-ask looks like, what implied volatility is saying.
The mistake beginners make is treating this as a static snapshot, like a photograph. It isn’t. It’s a living document that’s rewriting itself every few seconds. The same way a Level 2 order book tells you where buyers and sellers are positioned right now, the option chain tells you where the expectations and commitments of the entire market are positioned.
That’s a very different thing from just looking at where premium is highest.
Suggested Read: How to Use PCR (Put-Call Ratio) as a Trading Signal in Nifty Options, and 4 Traps to Avoid
6 Core Components: What They Actually Mean
1. Open Interest (OI)
OI is the total number of outstanding contracts that have not been settled. A contract enters OI when it’s opened and leaves when it’s closed or expires.
The critical point: OI tells you about commitment, not direction. A strike with massive OI has a lot of money behind it from both buyers and sellers of that contract. It does not tell you who is winning, who is losing, or who will act first.
2. Change in OI
This is where things start getting interesting. The change in OI during the session tells you whether new positions are being created or existing positions are being closed.
- When both OI and price rise together, it usually indicates fresh long buildup and growing bullish conviction.
- When OI rises while price falls, it often signals fresh short buildup and increasing bearish conviction.
- When OI falls but price rises, it suggests short covering. The price is moving higher because short sellers are exiting their positions, not necessarily because new buyers are entering. This is generally considered a weaker bullish signal.
- When both OI and price fall, it points to long unwinding. Existing long positions are being closed, making it a bearish signal, though typically less aggressive than fresh short selling.
This four-quadrant framework is fundamental to option chain analysis. The same price movement can carry a very different meaning depending on what Open Interest is doing alongside it.
3. Volume
Volume tells you how much has been traded in the current session, regardless of whether positions were opened or closed. High volume on a strike means that strike is active. It doesn’t tell you direction.
The relationship between volume and OI is what matters. High volume with rising OI = strong conviction, fresh positioning. High volume with falling OI = active position closing, transition.
4. Bid-Ask Spread
A narrow bid-ask spread means a liquid option with active market making. A wide spread means you’re in illiquid territory, and that illiquidity is a trap, not an opportunity.
Far OTM strikes with wide spreads are where retail traders go to “take a shot” and where they consistently lose money to slippage alone. When a 100-rupee option has a 10-rupee bid-ask spread, you’re starting every trade at a 10% loss before the market moves even one point.
5. Implied Volatility (IV)
IV is not what volatility is; it’s what the options market expects volatility to be. It’s priced in. And this distinction is everything.
When IV is high, options are expensive. Premium buyers are paying heavily for the right to participate. When IV is low, options are cheap. Writers are collecting modest premiums but selling in a potentially explosive environment.
The most important IV-based insight in Nifty options: IV crush.
After a major event like, Budget, RBI policy, election results, the IV collapses sharply because the uncertainty that was priced in has resolved.
This is why traders who correctly predicted the direction of Nifty on Budget day still lost money on their options. They were right on direction, wrong on the mechanics. The IV they paid for evaporated faster than the directional move could compensate.
6. Option Greeks
Delta: How much the option’s price moves for every 1-point move in Nifty. An ATM option has delta around 0.5; it moves roughly 50 paise for every 1-point Nifty move. Deep ITM options have delta near 1. Far OTM options have delta near zero.
Gamma: How fast delta changes as Nifty moves. Near expiry, ATM gamma is extremely high, a small Nifty move causes a dramatic delta shift. This is why near-expiry ATM options can double or halve in minutes.
Theta: The daily cost of holding an option. Time works against buyers and in favor of writers. An option losing 50 rupees a day to theta while sitting still is doing exactly what the option seller designed it to do.
Vega: Sensitivity to IV changes. Long options gain when IV rises; short options gain when IV falls. If you’re holding long options going into an event, you’re long vega, you want IV to expand further, or at minimum not collapse.
Understanding these four together tells you the full story of why an option is priced the way it is and how it will behave under different market conditions.
Suggested Read: The #1 Hidden Trap Behind Options Buying During Big Market Moves
Advanced Interpretation: How the Chain Is Actually Telling a Story
Identifying Aggressive Writing vs Passive Accumulation
There’s a fundamental difference between OI that has built up gradually over several sessions and OI that appeared aggressively in a single session or single time window.
Gradual OI buildup typically reflects institutional positioning, like, the hedges, systematic strategies, delta-neutral constructions. It’s sticky OI. It doesn’t move easily.
Aggressive intraday OI buildup at a specific strike often reflects a directional bet or a strong conviction by large participants that a level will hold (or break). This kind of OI is more dynamic and more significant as a near-term signal.
The way to identify aggressive writing: watch for sudden large jumps in OI at a specific strike in a short time window, accompanied by rising premiums (confirming buyers are absorbing the supply) or falling premiums (confirming writers are pushing price down through volume).
Fresh Writing vs Short Covering
This distinction is critical and almost always overlooked.
When Nifty reverses from a support level and runs 100 points higher in 20 minutes, two things could be happening in the option chain:
- Fresh call buying with rising OI in call options
- Put short covering, with put writers buying back their positions to close
The first scenario means new bullish money is entering. The second means old bearish money is exiting. Both drive prices higher. But only the first represents true directional conviction. Short covering-driven rallies often reverse quickly because once the pain is covered, the buying stops.
You can read this in real-time: if OI in puts is falling sharply during the rally, you’re watching short covering, not genuine buying. If call OI is rising, genuine longs are entering.
Suggested Read: How to Trade Index Options Around Earnings Season Without Getting Trapped?
Trapped Options Writers and Explosive Moves
One of the most powerful concepts in option chain analysis, and one of the least discussed in retail education is the trapped writer.
When option writers build large positions at a specific strike and the market moves aggressively toward that strike, those writers face a choice: hold, roll, or cover. If enough of them cover simultaneously, they create a cascade. Writers covering call positions must buy calls; this buying drives up call premiums, which makes it more expensive for other writers to hold, which forces more covering.
This is why Nifty sometimes runs through a “resistance level” identified by high call OI with shocking speed and almost no pullback. The resistance was real until it wasn’t, and when it broke, the trapped writers created the fuel for the next leg.
This is the concept of a gamma squeeze in simple terms. Near expiry, as delta approaches 1 for an ATM option, every 1-point Nifty move creates more delta exposure than it did earlier in the week. Writers have to hedge more aggressively. This mechanical process amplifies moves.
Why the Magnet Effect Happens
The max pain strike: the level where the maximum number of options expire worthless, acts as a gravitational pull as expiry approaches. But the mechanism is more interesting than “market moves to max pain.”
What actually happens is that market makers and institutional writers, who have large short gamma positions across many strikes, hedge their exposure by buying or selling the underlying. As expiry approaches and Nifty drifts toward a strike with heavy OI on both sides, the hedging behavior of these large players creates actual buying below and selling above – mechanically pulling price toward that strike.
This is not a conspiracy. It’s the rational hedging behavior of participants with complex books. The result looks like manipulation from the outside; from the inside, it’s just risk management.
For traders, the practical implication: in the final 60-90 minutes of a weekly expiry session, there is often a drift toward the max pain strike unless an external shock disrupts the natural hedging flow. Understanding this dynamic can help you avoid being on the wrong side of “mysterious” last-hour reversals.
How IV Tells You What the Market Actually Expects
Most traders watch price. The option chain lets you watch conviction about price.
When IV across all strikes compresses uniformly, it often signals a market consensus that no major move is expected. This happens in sideways environments where market makers are comfortable selling premium at modest levels.
IV skew is more revealing. If put IV is significantly higher than call IV at the same distance from the money, it means the market is paying more for downside protection than upside participation. This is “negative skew”, and it’s persistent in Nifty options because of the way institutions structure their hedges. But when skew becomes extreme, when put IV is trading at an unusual premium to call IV, it often signals genuine institutional fear, not just routine hedging.
Watch for unusual IV spikes at specific strikes even when adjacent strikes are calm. This is sometimes a tell that someone with information is positioning, or that a market maker is seeing large order flow in that strike that isn’t yet visible in OI.
Market Structure Shifts: How the Option Chain Behaves Differently
In Trending Markets
When Nifty is in a clearly trending move, the option chain shows consistent patterns: OI at the resistance (in an uptrend) consistently shifts higher as each level is broken. Writers keep repositioning their call strikes higher. Fresh put writing appears at new support levels. The chain is effectively chasing the trend, not fighting it.
Trying to use the option chain as a reversal signal in a strong trend is how traders lose money for weeks before finally accepting the direction.
During Expiry Week
All rules change.
Weekly expiry creates unique dynamics. OI concentrates heavily around ATM and near-ATM strikes. Gamma becomes dominant. Small Nifty moves cause disproportionate option price moves. Liquidity in far OTM options drops sharply.
In expiry week, high OI at a strike doesn’t mean what it means during a normal session. It may simply reflect the mechanical concentration of all remaining contracts near the money as time runs out.
The most important thing to track in expiry week isn’t where OI is highest, it’s how OI is shifting across strikes intraday. That shift tells you where the pressure is building and where the path of least resistance lies.
On Event Days: Budget, RBI, Elections
Option chain data on event days is almost entirely driven by IV dynamics, not directional conviction. The entire chain inflates in the days before the event. On the day itself, the chain deflates after the event regardless of what happens.
The practical failure mode: traders see high IV as a signal that “the market is expecting a big move” and buy straddles or directional options at peak premium. The event occurs, the market moves, but the IV collapses by 30-40% and their options end up worth less than what they paid.
On these days, the smarter read is: who is writing premium aggressively? That’s typically the institutional money comfortable enough with the risk to collect elevated premiums. The chain tends to tell you that story through volume in writing-side activity.
How Institutions Use Option Chain While Retail Reads It Differently
Here’s an uncomfortable reality: the option chain that you’re reading as a directional signal is often data generated by institutional positioning that is not directional at all.
Delta-neutral strategies, like, iron condors, ratio spreads, calendar spreads, generate massive OI without any directional intent. A fund running a volatility-selling strategy has huge put and call OI across multiple strikes, and that data looks like “strong resistance here, strong support there” to a retail trader who doesn’t know the strategy creating it.
When that strategy is unwound or rolled, the OI disappears – not because the market decided the level wasn’t important, but because a fund manager decided to adjust their book.
This is how “fake support and resistance” appears and disappears in the option chain. The OI was never support in the directional sense. It was the footprint of a non-directional institutional trade.
The way to partially filter this: watch for OI that appears quickly (suspicious), OI that is concentrated in a single unusual lot size (often systematic), and OI that disappears or moves in a block during the session.
Practical Framework: How to Actually Read the Option Chain
The Morning Framework (9:15 – 9:30 AM)
Start with OI PCR to get overall market sentiment context. Check where maximum OI sits on both sides. Note any unusual IV spikes or compressions versus yesterday. Identify the strikes that will define the day’s range based on structural OI, not just peak OI.
Most importantly: do not commit to any directional bias from the option chain alone before the first 15 minutes of price action reveal where actual order flow is heading.
The Intraday Reading Framework
Every 30-45 minutes, refresh your OI tracking at the key strikes you identified.
What has changed?
- Is OI building aggressively at a strike that was quiet at open? Who is writing there, and why?
- Is OI unwinding at the “resistance” level as Nifty approaches it? That’s often a sign that writers are covering rather than defending, which is a breakout signal.
- Is volume climbing at a strike without corresponding OI change? That’s high activity without new commitment; churn, not conviction.
Combining Option Chain with Price Action
The option chain is most powerful when it confirms what price is already trying to tell you.
A textbook setup: Nifty approaches a level where 3 sessions of call OI have been steadily building. As it arrives at that level, you see OI in call options starting to fall – writers covering. Simultaneously, price makes a higher low on a 5-minute chart and volume picks up. This is a confluence signal. The chain is confirming what price action is showing. That’s the kind of setup where experienced traders act.
Contrast this with trading the option chain in isolation: “Large call OI at 21,500, so I’ll buy puts near 21,500.” This ignores price structure entirely. If Nifty is in a breakout above all major moving averages with strong momentum, that call OI may be short-lived resistance, not a wall.
Common Myths Addressed Directly
Myth 1: “Highest OI strike is the strongest support or resistance.”
Only sometimes. Large OI can be from hedging that has no directional defense attached to it. It can be from a strategy that will simply roll rather than defend. Highest OI tells you where the most activity has been, not where the most conviction is.
Myth 2: “Max Pain is manipulated by institutions.”
Max pain is a mathematical result, not a conspiracy. Market makers don’t “push” Nifty to max pain. Their hedging activity creates the effect. The distinction matters: one implies intent, the other implies mechanics.
Myth 3: “Rising PCR means the market will rally.”
As covered in the PCR-specific context – not always. Rising PCR during institutional hedging activity is routine and says nothing about near-term direction.
Myth 4: “Option writers are always more informed than buyers.”
Option writers have higher win rates but they’re not omniscient. A covered call writer who gets a gap-up is wrong, regardless of their statistical edge. The market can and does defeat even well-constructed short premium positions.
The Real Edge in Option Chain Analysis
Here is the honest summary of what reading the option chain actually gives you.
It doesn’t give you a crystal ball. It doesn’t tell you what Nifty will do next. It doesn’t give you a cheat code.
What it gives you is a deeper read of where the tension is in the market at any moment. It tells you who is committed and where. It tells you where a surprise could cause a cascade reaction. It tells you whether the market is in a stable equilibrium (high OI, low IV, balanced PCR) or an unstable one (building OI in one direction, skewed IV, concentrated positioning).
Stable markets stay calm until they don’t. Unstable markets look calm until suddenly they don’t. The option chain, read properly, often shows you the difference before price confirms it.
That’s not prediction. That’s preparation.
And in trading, preparation is everything.
The option chain is not a signal. It’s a conversation between every participant in the market. The traders who get genuine edge from it are the ones who learned to listen to the whole conversation – not just the loudest word in the room.
Bottom Line
The biggest mistake traders make with the NSE option chain is expecting it to predict the future.
It can’t.
The option chain is not a crystal ball, a magic indicator, or a shortcut to easy profits. What it does provide is something arguably more valuable: a real-time view of where money is positioned, where pressure is building, and where traders may be forced to react.
The difference between an average trader and a skilled option chain reader is not access to better data. Everyone sees the same numbers. The difference is interpretation.
Instead of asking, “Where is the highest OI?” start asking deeper questions. Is that OI fresh or old? Is it being defended or unwound? Is the move driven by new positions, short covering, hedging activity, or institutional repositioning?
That’s where the real edge lives.
Used correctly, the option chain helps you understand market structure, not predict market direction. It allows you to prepare for different scenarios rather than blindly betting on one outcome.
And in options trading, preparation almost always beats prediction. The traders who survive and thrive are usually the ones who spend less time guessing where Nifty will go next and more time understanding what the market is already telling them.
Disclaimer: Investments in the securities market are subject to market risks, read all related documents carefully before investing.
Options trading involves substantial risk and may not be suitable for all investors. The information provided in this article is for educational and informational purposes only and should not be construed as investment, trading, or financial advice. Option chain analysis is a tool for understanding market positioning and sentiment, but it cannot predict future market movements with certainty. Readers should conduct their own research and assess their financial situation and risk tolerance before making any trading or investment decisions.
FAQs
Can Option Chain Predict Market Direction?
No. The option chain cannot predict market direction with certainty. It helps traders understand positioning, sentiment, and potential areas of support or resistance, but actual price movement is driven by real-time order flow and market participation.
What Is the Difference Between OI and Volume?
Open Interest (OI) represents the total number of active contracts that remain open, while volume shows how many contracts were traded during the session. Rising volume with rising OI suggests fresh participation, while high volume with falling OI often indicates position closing.
Is Option Chain Analysis Reliable for Intraday Trading?
Option chain analysis can be useful for intraday trading, but it should not be used in isolation. Since OI and positioning can change quickly, traders should combine option chain data with price action, volume, and overall market context.
How to Use Option Chain with Price Action?
Price action should be used to identify trend and key levels, while the option chain can be used for confirmation. For example, OI unwinding near resistance may support a breakout view, while fresh writing at a level may strengthen a reversal case.