
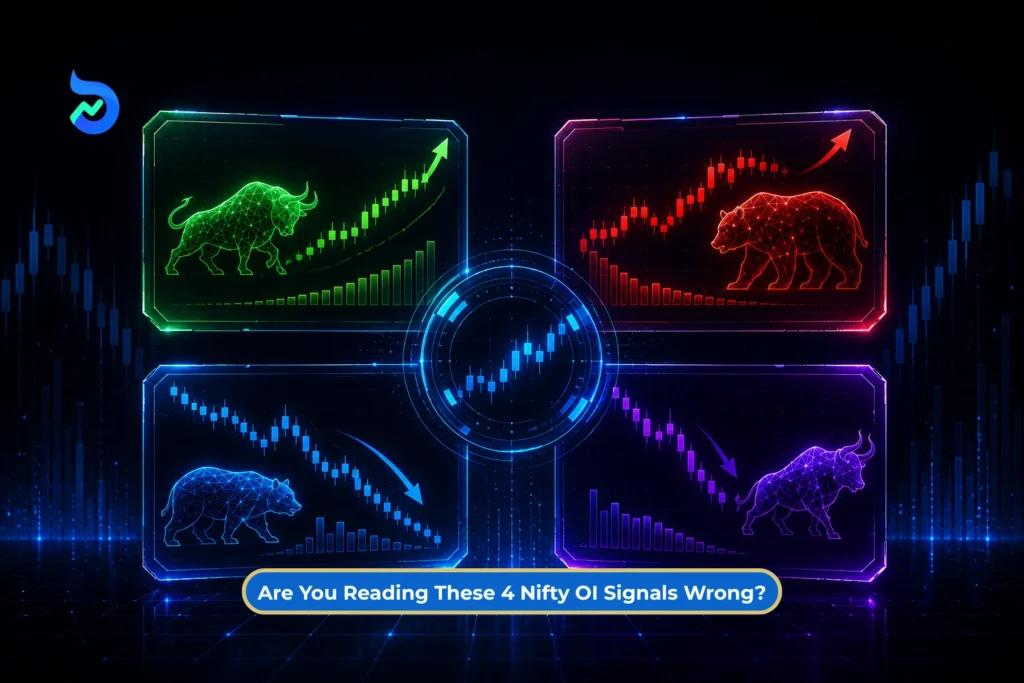
Open interest often appears beside price and volume on a derivatives screen. Yet it is frequently read as a direct bullish or bearish signal. Rising OI is called positive, while large OI at an option strike is treated as proof of support or resistance.
None of these conclusions can be drawn from OI alone.
Long buildup, short buildup, short covering and long unwinding compare a futures contract’s price movement with its change in OI. They describe changing participation but cannot reveal the intention behind every position.
This distinction is essential when analysing Nifty futures and options.
Let’s cut through the noise!
What Does Open Interest Actually Measure?
Open interest, or OI, is the number of derivative contracts that remain outstanding. These contracts have not been closed through an opposite transaction or completed through expiry, exercise or settlement.
NSE specifies that only one side of a derivative contract is counted while calculating OI. Every open futures contract has one long and one short side, but the contract is counted once.
Consequently, rising OI means outstanding contracts have increased; falling OI means they have decreased. Neither change independently reveals market direction.
The way a trade affects OI depends on the positions of both parties:
- OI increases when a new buyer and a new seller create a contract.
- OI decreases when an existing long and an existing short both close.
- OI remains unchanged when an opening position replaces a closing position.
OI should also not be confused with volume.
| Metric | What It Measures |
| Volume | Contracts traded during a selected period |
| Open interest | Contracts that remain outstanding |
| Change in OI | Net increase or decrease in outstanding contracts |
Volume rises as contracts change hands. OI changes only when the number of open contracts changes. NISM similarly distinguishes volume as trading activity from OI as outstanding positions.
How Price and OI Create the Four Common Signals
The four conventional OI signals come from a simple two-part comparison:
- Did the futures price rise or fall?
- Did OI in that futures contract rise or fall?
| Nifty Futures Price | Open Interest | Common Interpretation |
| Rising | Rising | Long buildup |
| Falling | Rising | Short buildup |
| Rising | Falling | Short covering |
| Falling | Falling | Long unwinding |
The price and OI should belong to the same Nifty futures contract and cover the same observation period.
These combinations are conventional interpretations of market behaviour. They are not a direct classification of every participant’s trade.
1. What Is Long Buildup?
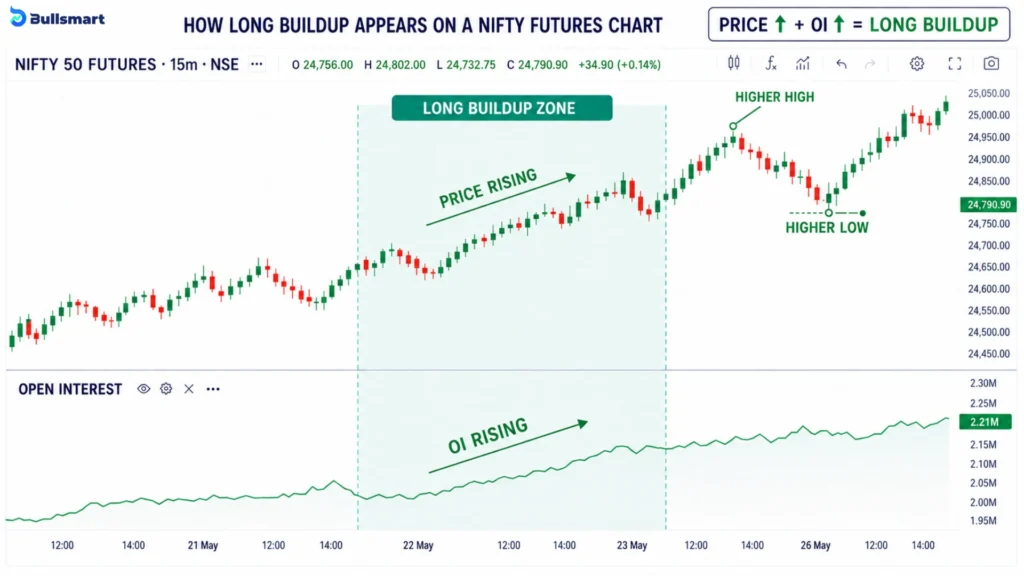
Long buildup is the conventional term used when a futures contract’s price and open interest rise during the same observation period.
How Does Long Buildup Work?
For OI to increase, both parties to a newly matched contract must be opening positions:
- The buyer opens or increases a long position.
- The seller opens or increases a short position.
- A new outstanding contract is created.
The rise in price means trades occurred at progressively higher levels during the period. When this is accompanied by increasing OI, the combination is commonly described as long buildup.
However, the label does not mean that only long positions were created. Every new long futures position has a corresponding short position. It also does not prove why either party entered the contract.
More Details
- Aggregate long and short OI are equal because every contract has both sides.
- If a new long replaces an existing long who is closing, OI remains unchanged.
- Rising OI near expiry may partly reflect positions being moved into another expiry.
- A large percentage change in OI may result from a small starting base.
- The combination describes what happened during the selected period. It does not establish that the price will continue rising.
2. What Is Short Buildup?
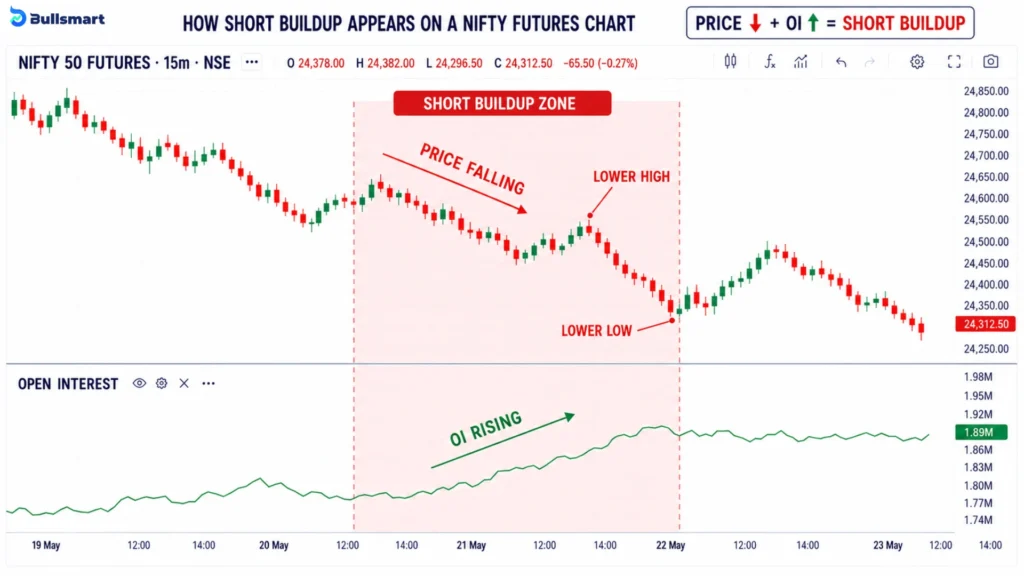
Short buildup is the conventional term used when a futures contract’s price declines while its OI increases.
How Does Short Buildup Work?
The increase in OI requires the creation of new contracts:
- The seller opens or increases a short position.
- The buyer opens or increases a long position.
- The newly created contract increases OI.
The falling price means trades occurred at progressively lower levels during the period. This price-OI combination is commonly described as short buildup.
The name can be misunderstood because new long positions are also created. It describes the direction of price while outstanding participation expands; it does not show that only short sellers entered.
More Details
- OI does not reveal whether a position is speculative, hedged or part of a multi-leg strategy.
- If an existing long closes against a new short, OI remains unchanged because one position replaces another.
- An increase in OI around rollover may include positions transferred from a different expiry.
- Aggregate data cannot identify which participant initiated a trade.
- Short buildup is a descriptive classification. It does not establish that the price will continue falling.
3. What Is Short Covering?
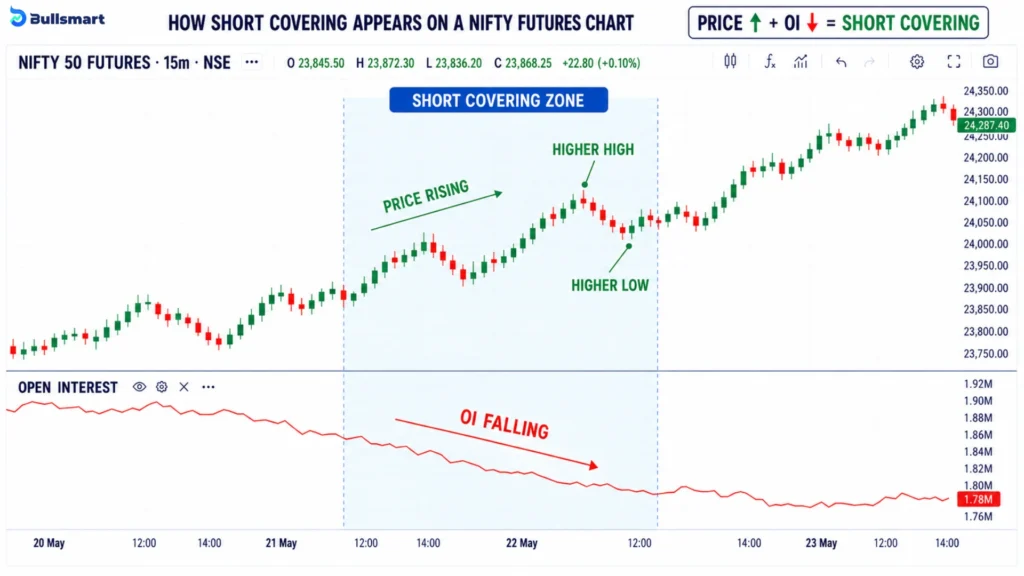
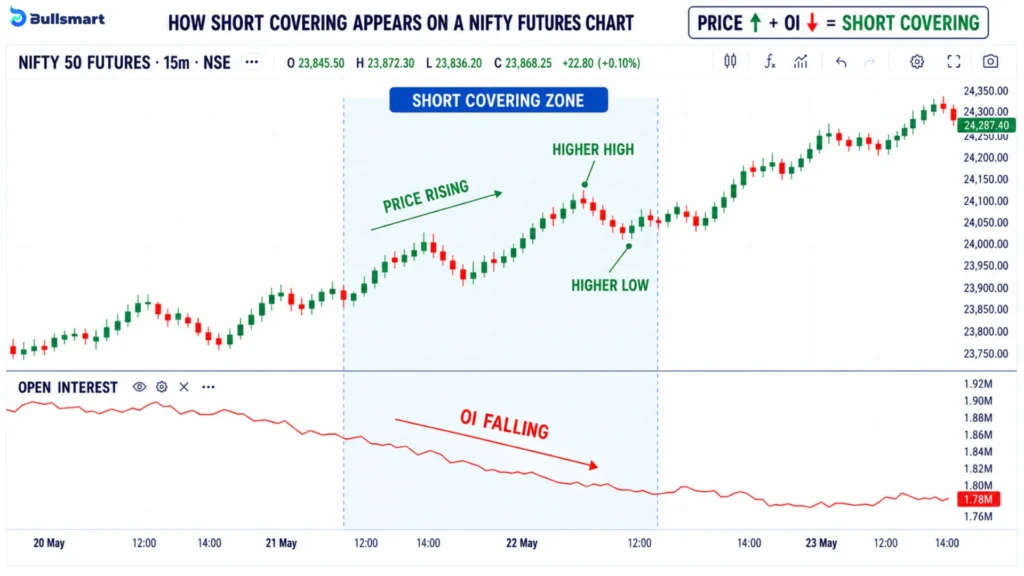
Short covering is the conventional term used when a futures contract’s price rises while its OI declines.
How Does Short Covering Work?
A short futures position is closed through an offsetting purchase. However, for total OI to decline, both sides of an existing contract must close:
- The existing short buys to close the short position.
- The existing long sells to close the long position.
- The contract is removed from OI.
Because the price rises while outstanding contracts decline, the combination is commonly labelled short covering.
Aggregate OI does not directly prove that short-position exits caused the entire price rise. It only confirms that net contract closure occurred alongside a higher futures price.
More Details
- If an existing short closes against a new short seller, OI remains unchanged.
- Both a short position and a corresponding long position are closed when OI declines.
- Rising price with falling OI represents contracting outstanding participation rather than net creation of new contracts.
- A short-covering classification does not establish that a new upward trend has started.
- If the price and OI relationship later changes, the subsequent period must be classified separately.
4. What Is Long Unwinding?
Long unwinding is the conventional term used when a futures contract’s price and OI both decline.
How Does Long Unwinding Work?
A long futures position is closed through an offsetting sale. For aggregate OI to decline:
- The existing long sells to close the long position.
- The existing short buys to close the short position.
- The outstanding contract ceases to remain open.
Because the futures price falls while open contracts decline, the combination is commonly labelled long unwinding.
The label does not mean that only long positions disappeared. Both sides of the contract are closed when OI falls. It also does not directly identify which side had the greater influence on the price movement.
More Details
- If an existing long sells to a new short, OI remains unchanged because the open contract continues with a different participant.
- Falling OI does not show that fresh short positions are increasing.
- Position closures may relate to risk reduction, profit-booking, hedging changes, rollover or expiry.
- Aggregate OI cannot separate these different purposes.
- Long unwinding describes a completed price-OI observation. It does not establish that the price will continue falling or subsequently reverse.
Note: These classifications describe historical changes in futures price and open interest. They are not trading signals, investment advice, recommendations, forecasts, or assurances of future market movement.
Suggested Read: 11 Smart Money Concepts for Indian Traders for a Practical Analysis Framework
Long Buildup vs Short Covering and Short Buildup vs Long Unwinding
Price direction alone cannot distinguish between fresh position creation and position closure.
| Price and OI Movement | Common Reading | What OI Adds |
| Price rises; OI rises | Long buildup | Outstanding positions may be increasing |
| Price rises; OI falls | Short covering | Outstanding positions may be decreasing |
| Price falls; OI rises | Short buildup | Outstanding positions may be increasing |
| Price falls; OI falls | Long unwinding | Outstanding positions may be decreasing |
A rising market can show long buildup or short covering; a falling market can show short buildup or long unwinding.
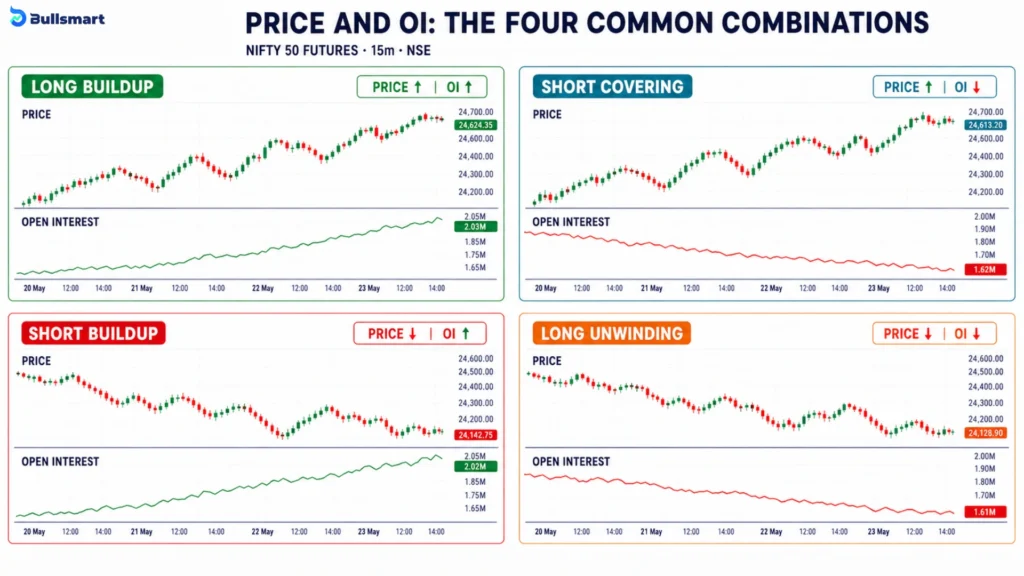
OI separates expanding participation from position closure, but cannot prove who initiated the move or why.
Suggested Read: Supertrend Indicator’s 2 Core Components & the Powerful Setting Behind Clearer Signals
Why Nifty Traders Commonly Read These OI Signals Wrong
1. Treating Rising OI as Automatically Bullish
An increase in OI only means that more contracts remain open. It may accompany either long buildup or short buildup. Price direction is needed before applying the conventional label.
2. Forgetting That Every Futures Contract Has Two Sides
One party’s long position is matched by another party’s short position. OI cannot increase through the creation of only long or only short contracts. It measures outstanding contracts, not a one-sided headcount.
The CFTC also confirms that aggregate long OI is equal to aggregate short OI.
3. Comparing Nifty Spot with Unmatched Futures OI
Nifty spot and Nifty futures are related but different instruments. Futures may trade above or below spot; their difference is called the basis, and futures pricing is connected to cost of carry.
Use the price and OI of the same futures contract and period. Combining Nifty spot with OI from a separate futures expiry weakens the reading.
4. Ignoring Contract Expiry and Rollover
NSE lists Nifty 50 index futures in near, mid, and far month contracts. As the near-month contract approaches expiry, positions may be closed there and opened at a later expiry.
A decline in near-month OI can therefore reflect rollover activity rather than a simple directional exit. OI across nearby expiries should be compared before drawing a conclusion.
5. Treating One Reading as a Confirmed Trend
Hedging, an approaching expiry, an event or routine position adjustment can affect one observation. Repeated price; OI behaviour provides better context.
6. Assuming OI Reveals Why a Position Exists
Nifty derivatives can be used for speculation, hedging and multi-leg strategies. Aggregate OI cannot separate these motives. A position that looks directionally bearish in isolation may be hedging another exposure.
Suggested Read: Ichimoku Cloud Trading Strategy & 7 Crucial Signals for Indian Markets
Can the Same Framework Be Applied to Nifty Options?
The framework is clearer for the price and OI of the same futures contract. Applying it mechanically to option premiums creates additional problems.
Option premiums are influenced by the underlying price, strike, time to expiry, volatility and risk-free rate, among other factors. They can therefore change for reasons beyond market direction.
Every open option contract also has a buyer and seller. Rising call OI does not prove that writers are adding positions. A falling call premium with rising OI should not automatically be called writing; the premium may be responding to the underlying, time decay or volatility.
High call OI does not guarantee resistance, and high put OI does not guarantee support. It shows concentrated open contracts, which may include bought options, written options, spreads and hedges.
Option-chain OI can identify where outstanding positions are concentrated. It cannot reveal the complete strategy behind them.
A Practical Framework for Reading Nifty Futures OI
Step 1: Start with One Contract
First, decide which Nifty futures contract you are studying. It could be the near-month, mid-month or far-month contract. Keep using the same expiry throughout the comparison, as each contract has its own price and OI.
Step 2: Compare the Same Period
Make sure the price change and OI change cover the same period. If you are using end-of-day price data, compare it with end-of-day OI. For intraday analysis, use the same intraday interval for both.
NSE’s contract-wise historical data provides price, volume and OI information for individual contracts.
Step 3: Identify the Price and OI Combination
Now observe how price and OI moved together:
- Price up and OI up: Long buildup
- Price down and OI up: Short buildup
- Price up and OI down: Short covering
- Price down and OI down: Long unwinding
Remember that these are conventional descriptions of the recorded movement. They do not confirm what the market will do next.
Step 4: Account for Rollover
OI can behave differently as expiry approaches. Positions may be closed in the near-month contract and opened in the next-month contract.
Therefore, falling near-month OI may not always represent a directional exit. If the next-month OI is rising at the same time, some positions may simply be moving to the later expiry.
Step 5: Put the Reading in Price Context
Next, look at where the price movement occurred. Did the futures price cross an important swing level, remain inside a range or move in line with the broader trend?
This context helps explain the price and OI combination without treating it as an isolated signal.
Step 6: Look at Volume Separately
Volume and OI answer different questions. Volume shows how many contracts were traded during the period, while OI shows how many contracts remained open.
Higher volume indicates greater trading activity, but it does not independently confirm whether the market is bullish or bearish.
Step 7: See What Happens Next
Avoid drawing a conclusion from one reading alone. Observe whether the same price and OI combination continues or changes during the following periods.
The classification may shift from short covering to long buildup or from long unwinding to short buildup. Each period should be assessed using its own price and OI data.
Step 8: Treat OI as Context, Not an Instruction
OI can add another layer to futures analysis, but it is not an entry, exit or directional instruction. It cannot determine future price movement or replace an independent assessment of market conditions, risk, costs and potential loss.
Nifty futures learning tool
Price and Open Interest Explorer
Adjust futures price and open interest over the same selected period. The simulator applies the conventional four-part classification and explains what the observation can, and cannot, establish.
Test the relationship
Compare changes from the same Nifty futures contract over the same observation period. These values are illustrative and are not live market data.
Price rises · OI rises
Long buildup
Outstanding contracts increased while the futures price rose. This combination is conventionally labelled long buildup.
Every futures contract has a long and short side, but only one side is counted in aggregate open interest.
Aggregate OI cannot show whether a position is directional, a hedge or one leg of a wider strategy.
Volume measures contracts traded during a period. OI measures contracts that remain open.
Near expiry, changing OI across two contracts may reflect rollover rather than a straightforward entry or exit.
This simulator uses illustrative percentage changes and does not use live market data. Its classifications describe selected futures price and open-interest combinations. They are not investment advice, research, recommendations, trading signals, forecasts or assurances of returns. No output should be used as the sole basis for a financial decision. The four-part matrix should not be transferred mechanically to options because option premiums are affected by additional factors.
What OI Analysis Can and Cannot Tell You
| OI Analysis Can Indicate | OI Analysis Cannot Prove |
| Whether outstanding contracts increased or decreased | Which side initiated every trade |
| How futures price moved alongside changing OI | Why each position was created |
| Whether a move resembles fresh buildup or position closure | That the price will continue in the same direction |
| Where option OI is concentrated | Guaranteed support or resistance |
| Whether OI is shifting between expiries | The complete strategy behind each position |
Bottom Line
The four OI labels look straightforward. Price and OI rise, call it long buildup. Price falls while OI rises, call it short buildup. Reverse the OI direction and the labels change to short covering or long unwinding.
But the labels only describe what the data did during a particular period. They do not reveal the activity behind it. Every futures contract still has a buyer and seller. A position may be directional, hedged, part of a spread or moving from one expiry to another.
This is also why option OI needs a separate lens. A change in premium can come from movement in the underlying, time decay or volatility. High OI at a strike shows concentration of open contracts, not confirmed writing, support or resistance.
That leaves OI with a useful but specific role. It shows whether outstanding participation expanded or contracted while the futures price moved. Long buildup, short buildup, short covering and long unwinding are simply names given to those four combinations. They explain the observed relationship between price and participation, without predicting what Nifty will do next.
Disclaimer: This article is intended only for educational and informational purposes. Open-interest interpretations do not guarantee market direction or trading results. Derivatives involve leverage and a high risk of loss. Readers should conduct independent research, assess their risk tolerance and consult a SEBI-registered investment adviser where appropriate.
FAQs
Is a long buildup bullish or bearish?
A long buildup is generally considered bullish because both price and open interest increase. This suggests fresh market positions are being created while buying interest is pushing the price higher. However, it does not guarantee that the rise will continue. Traders should also examine volume, price trends, support and resistance levels, and broader market conditions before interpreting the signal.
How to check short buildup?
A short buildup is usually identified when the price falls while open interest rises. The price decline indicates weakness, while increasing OI suggests that fresh positions are entering the market. Compare price and OI changes over the same period, then check volume, trend and key price levels for context. Short buildup should not be treated as a standalone trading signal.
What is the difference between long unwinding and short buildup?
Both involve a price decline, but their OI behaviour differs. In long unwinding, price and open interest both fall, suggesting existing long positions are being closed. In short buildup, price falls while OI rises, indicating the creation of fresh positions commonly interpreted as shorts. Therefore, one reflects position closure, while the other suggests new bearish participation.
Is high OI good or bad?
High open interest is neither inherently good nor bad. It simply means many derivative contracts remain outstanding in the market. It may indicate strong participation and potentially better liquidity, but it does not reveal direction by itself. Traders should study the change in OI alongside price, volume and market structure to understand whether positioning appears bullish, bearish or neutral.