
For Indian options traders who want to use PCR intelligently, not blindly.
The Lie You’ve Been Told About PCR
Here’s a scene that plays out in thousands of trading setups across India every morning.
A trader opens NSE’s option chain, glances at the PCR, sees it’s above 1.2, and immediately concludes: “Market is bullish. I’ll buy calls.” By noon, Nifty has dropped 150 points and the calls are down 40%. The PCR was “right” on the surface, it showed high put buying; but the trader completely misread what it was signaling.
This is the most common and expensive PCR mistake in retail options trading. And it happens not because PCR is a bad tool, but because most traders understand only the surface definition, not the actual market mechanics underneath it.
PCR is simultaneously one of the most watched and one of the most misunderstood indicators in Indian options markets. Used well, it gives you a genuine edge. Used carelessly, it’s a trap.
Let’s go deep.
What PCR Actually Measures, And What It Doesn’t
Put-Call Ratio is simply the ratio of put options to call options, measured either by trading volume or open interest.
Formula:
Volume PCR = Total Put Volume / Total Call Volume
OI PCR = Total Put Open Interest / Total Call Open Interest
That’s the easy part. The hard part is understanding what the numbers actually mean in the context of live market behavior.
When more puts are being bought relative to calls, the PCR rises. When more calls are bought, it falls. The conventional interpretation: PCR above 1 = bearish sentiment, PCR below 1 = bullish sentiment.
But this surface-level reading is exactly where most traders trip.
Suggsted Rad: Confirmation Bias in Trading: Why Traders Find 10 Inspiring Reasons to Enter but Zero Reasons to Exit
Volume PCR vs Open Interest PCRT: They’re Not the Same Thing
This distinction matters far more than most traders realize.
| Feature | Volume PCR | OI PCR |
| What it captures | Today’s trading activity | Accumulated positions over time |
| Speed of signal | Fast-moving, intraday sensitive | Slower, reflects longer-term sentiment |
| Noise level | High -can spike on single large trades | Lower -smoother, more structural |
| Best use case | Intraday sentiment shifts | Swing trading, market structure reading |
| Sensitivity to expiry | Very high near expiry | Moderately high |
| Influence of hedging | Often masks true directional intent | More likely to reflect actual positioning |
OI PCR is generally considered more reliable for swing and positional traders.
It represents real money that is sitting in positions, not just the churn of intraday speculation.
Volume PCR, on the other hand, can move dramatically on a single block trade from an institution or a heavy news event. Seeing Volume PCR jump from 0.8 to 1.5 in an hour tells you something is happening, but not necessarily what you think.
The most experienced Nifty options traders watch both, but weight OI PCR more heavily when making longer-duration trade decisions.
Why Institutional Traders Read Put-Call Ratio Completely Differently
Here’s something retail traders are rarely told: a large portion of put buying in Nifty is not directional speculation. It’s hedging.
Mutual funds, portfolio management services, and FIIs routinely buy Nifty puts to protect their long equity portfolios. When markets have been rallying for weeks and institutional money is sitting on large equity positions, put buying increases significantly. This mechanically pushes PCR higher.
So a rising Put-Call Ratio during a market uptrend can simply mean: “Large players are protecting their gains,” not “Large players think the market is going to fall.”
This is a critical nuance. Retail traders see a high PCR and think bearishness. Institutions look at the same number and often see it as a sign of smart hedging behavior, which is actually a sign that the underlying equity appetite is still strong.
The flip side is equally important. When institutions put hedges that expire worthless during an extended rally, Put-Call Ratio drops. Retail traders see falling Put-Call Ratio and interpret it as bullishness. Institutions may be reading it as: “Hedges have rolled off, positioning is lighter, the market may be vulnerable.”
Suggested Read: How to Trade Index Options Around Earnings Season Without Getting Trapped in 2026?
How PCR Reflects Market Sentiment: The Contrarian Logic
This is where Put-Call Ratio gets genuinely interesting.
Put-Call Ratio is used by experienced traders as a contrarian sentiment indicator. The logic goes like this:
When everyone and their broker is buying puts, when fear is at an extreme, who is left to sell? When fear is fully priced in, the marginal seller of panic has already sold. The market often doesn’t have many incremental bears left to drive it lower.
This is why extremely high Put-Call Ratio readings can actually be bullish signals rather than bearish ones.
Similarly, when Put-Call Ratio is extremely low, when euphoria is everywhere, and every retail trader is buying calls, that’s often when markets are most vulnerable to sharp pullbacks. Too many bulls, not enough buyers left.
This is the contrarian version of Put-Call Ratio. And it’s where professional traders operate.
Rough benchmarks for Nifty Put-Call Ratio (OI-based):
| PCR Range | Conventional Read | Contrarian Read |
| Below 0.7 | Bullish | Potentially overbought / caution |
| 0.7 – 1.0 | Mildly bullish | Neutral |
| 1.0 – 1.2 | Neutral to mildly bearish | Neutral |
| 1.2 – 1.5 | Bearish | Potential support zone forming |
| Above 1.5 | Very bearish | Extreme fear -watch for reversal |
These ranges are indicative, not absolute. Context is everything.
Suggested Read: The #1 Hidden Trap Behind Options Buying During Big Market Moves
Put-Call Ratio During Trending Markets vs Sideways Markets
This is a distinction that kills most Put-Call Ratio-based strategies.
In a clearly trending market, the Put-Call Ratio becomes far less reliable as a reversal signal. During the 2020-2021 bull run, Nifty OI PCR stayed in elevated ranges for extended periods because institutions were continuously hedging long positions. Traders who read high PCR as “the market will reverse soon” kept getting run over.
In a strong trending market, Put-Call Ratio follows the trend’s internal logic. Puts get bought as protection, not as directional bets. Fading a trend because PCR is high is one of the costliest strategies in options trading.
In sideways, range-bound markets, Put-Call Ratio becomes much more useful. When Nifty is oscillating between clear support and resistance levels, PCR extremes at the edges of the range often coincide with short-term reversals. This is where PCR’s contrarian value actually shows up cleanly.
The practical lesson: Before you interpret any PCR reading, first answer the question: is the market trending or is it consolidating? That single context check will prevent most PCR-related trading errors.
PCR During Expiry Week: A Different Animal Entirely
Expiry week How to Use PCR (Put-Call Ratio) as a Trading Signal in Nifty Options, and 4 Traps to Avoid behavior deserves its own section because it operates by completely different rules.
As Nifty weekly or monthly expiry approaches, several mechanical distortions hit PCR simultaneously:
- Short-term hedges roll off or expire, changing OI composition dramatically
- Gamma plays intensify, with sharp intraday strikes of high OI puts and calls getting bought and sold
- Max pain dynamics pull the index toward the strike with maximum option seller profit, often creating temporary PCR distortions
- Retail FOMO in both directions spikes volume PCR erratically
On expiry day, it’s not unusual to see PCR readings that look extreme but are entirely explained by the mechanical unwinding of positions rather than any genuine directional conviction.
Many experienced traders reduce PCR reliance significantly during the last two days before expiry. They focus instead on price action around key strikes, Greece values, and India VIX behavior.
When PCR Gives False Signals: The Traps
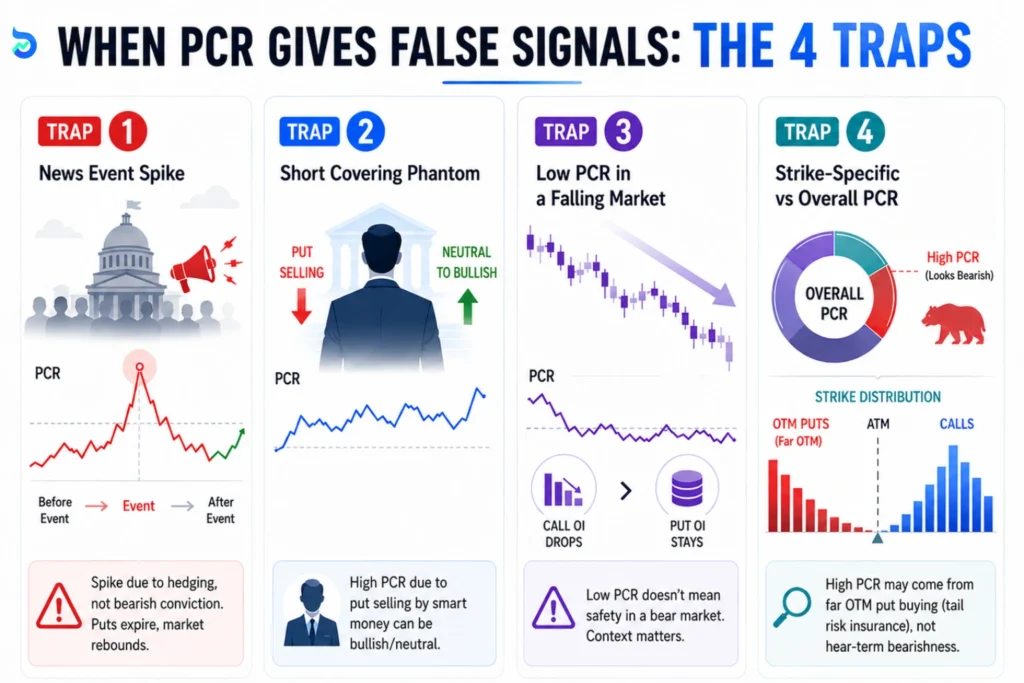
Trap 1: The News Event Spike
Before a major event: RBI policy, Union Budget, US Fed meeting, geopolitical news, traders aggressively buy puts as insurance. PCR can spike sharply, looking extremely bearish. But this is event hedging, not directional conviction. Once the event passes without drama, those puts expire worthless and the market rebounds. Traders who shorted the market because PCR was “very bearish” get squeezed badly.
Trap 2: The Short Covering Phantom
When institutional traders build large short positions in put options (i.e., they’re selling puts), PCR appears elevated even though the actual market maker intent is neutral to bullish. Elevated PCR driven by put selling by sophisticated players is the opposite of what surface-level PCR reading suggests.
Trap 3: The Low PCR in a Falling Market
Sometimes, during sharp bear markets, call options get abandoned quickly (they expire worthless, so OI drops) while put OI stays elevated. But the ratio can look moderate or even low in certain scenarios, depending on how strikes are distributed. Don’t assume low How to Use PCR (Put-Call Ratio) as a Trading Signal in Nifty Options, and 4 Traps to Avoid means safety in a bear market structure.
Trap 4: Strike-Specific vs Overall PCR
Nifty PCR is typically calculated across all strikes. But the distribution of puts and calls across strikes matters enormously. A high PCR might be driven by heavy out-of-the-money put buying at strikes 10% below market, which is pure tail-risk insurance, not near-term bearishness.
The Psychology Behind Extreme PCR Readings
Markets are moved by human behavior, and PCR is fundamentally a behavioral indicator.
When PCR is at extremes, it reflects a market where participants have moved toward emotional rather than analytical decision-making. Extreme fear (very high PCR) and extreme greed (very low PCR) are both unstable states. Markets tend to revert toward equilibrium.
Think about what happens when PCR crosses 1.5 in Nifty. At that point, most bearish scenarios are already well-known and well-priced. Anyone who wanted to buy puts already has. The remaining sellers of puts are institutions willing to take on that risk because they feel the premium is rich enough to compensate. This dynamic, where option sellers grow more confident at PCR extremes, is what often creates the reversal conditions.
The crowd has committed. And in markets, when the crowd is fully committed in one direction, that’s often when the trade starts reversing.
How to Actually Combine PCR with Other Tools
PCR in isolation is not a trade signal. It’s one data point in a larger mosaic. Here’s how to think about combining it:
PCR + Price Action
If PCR is elevated (above 1.3) AND price is near a strong multi-week support level with reversal candlestick patterns forming, the confluence is meaningful. PCR telling you fear is high, price action showing you where the line in the sand is, that’s a credible long setup.
PCR + India VIX
India VIX measures implied volatility; essentially how much the options market is “pricing in” fear. When PCR is high AND India VIX is spiking above 20-22, it indicates genuine panic. Historically, sharp VIX spikes combined with high PCR in Nifty have often preceded short-term bounces.
PCR + Open Interest Analysis
This is powerful. Look at where maximum open interest is sitting in the option chain. If PCR is high but most of that put OI is at strikes far below current levels, the bears aren’t really committed to near-term downside. But if put OI is building aggressively at strikes just below the current market price, that’s a different signal; meaningful near-term concern.
PCR + Support and Resistance
Never use PCR without mapping where price currently sits in its structure. A high PCR reading at a resistance zone means something very different from the same reading at a support zone.
PCR + Volume
If PCR spikes on heavy volume across the market; not just in options but in cash markets too, the signal is more credible. PCR spikes on thin volume are often noise
The Combined Framework in Practice
Scenario: Nifty drops 200 points in a day. PCR jumps to 1.45. India VIX is at 19, rising. Price is near a 200-DMA confluence zone. Put OI is building at the 21,500 strike, which coincides with prior consolidation support. Volume is elevated.
Reading: Multiple signals aligning. High PCR at structural support, VIX elevated but not extreme, OI building at logical support. This is a setup worth watching for a bounce, with clear invalidation below 21,500.
That’s how experienced traders actually use PCR, as one signal in a multi-factor read.
Nifty PCR vs Bank Nifty PCR: Which Behaves Better?
Both are widely tracked, but they have different characteristics.
Nifty PCR tends to be smoother and more institutionally driven. It reflects broader market sentiment with less noise. Better for swing and positional reads.
Bank Nifty PCR is more volatile and sensitive to sector-specific events: banking earnings, credit policy, NPA data, RBI decisions. It can whipsaw sharply on an intraday basis, making PCR-based reads much harder to use reliably.
Most serious options traders find Nifty PCR more actionable. Bank Nifty PCR is useful for context but requires tighter filters given its inherent volatility.
Intraday vs Swing Usage of PCR
For intraday traders, Volume PCR is more relevant, but the noise level is high. The most practical approach: watch PCR shifts during the first 30-45 minutes of the session as a sentiment read, then focus primarily on price action and order flow. PCR confirms; it doesn’t lead intraday.
For swing traders, OI PCR is the relevant metric. Look at end-of-day OI PCR readings over multiple consecutive sessions. When OI PCR consistently builds above 1.2-1.3 over 3-4 sessions while price stays stable, it often suggests a support base is forming. When OI PCR drops persistently despite the market holding its level, it can signal weakening conviction in bulls.
PCR Divergences: The Advanced Read
One of the most underused aspects of PCR analysis is divergence, when PCR and price move in different directions.
Bullish Divergence: Nifty makes a new low, but PCR doesn’t make a new high. This suggests that even though price is weaker, put buying is not escalating proportionally. Fear is not intensifying with the price move. Often a sign that the downtrend is losing steam.
Bearish Divergence: Nifty makes a new high, but PCR is rising instead of falling. Call buying is not keeping up with the market’s move higher. This could indicate institutional hedging is increasing as the market rallies, a warning sign that not everyone believes in the move.
Divergences are not trade signals by themselves but are powerful filters. When a divergence aligns with a key technical level and shifting price action, that’s a high-probability observation worth acting on.
Common Mistakes Traders Make with PCR
- Using PCR as the only entry trigger: No single indicator should ever be your only entry trigger. PCR is a sentiment context tool, not a buy/sell signal generator.
- Looking at PCR without checking the timeframe: Intraday PCR and daily PCR tell completely different stories. Mixing them up creates confusion.
- Ignoring strike distribution: Overall PCR says nothing about where puts and calls are concentrated. You need to read the option chain itself.
- Assuming PCR extremes mean immediate reversal: Extremes can persist. Markets can stay “overbought” or “oversold” for far longer than rational analysis suggests they should. PCR extremes indicate a zone of possibility, not a timing tool.
- Forgetting about hedging distortion: As discussed, institutional hedging inflates PCR. Not all high PCR is bearish.
- Ignoring India VIX context: PCR without VIX context is incomplete. A PCR of 1.4 during calm, low-VIX markets is not the same as 1.4 during a volatile, high-VIX environment.
The Bottom Line
PCR is genuinely useful. It gives you a window into the crowd’s emotional state; how fearful or euphoric the market has become. When you understand what’s driving it, you can use that sentiment context to your advantage.
But PCR is not an oracle. It doesn’t tell you what the market will do. It tells you what participants are currently positioned for, and sometimes the biggest moves come from squeezing exactly those positions.
The traders who get real value from PCR are the ones who use it to ask better questions, not to get easy answers. When PCR is extremely high, they don’t blindly go long. They ask: is this genuine fear or mechanical hedging? Is price confirming capitulation? What does VIX say? Where is the option chain showing real structural defense?
And when everything lines up, PCR, price structure, VIX context, option chain positioning, that’s when PCR earns its keep in a real trading setup.
Every tool in technical analysis, including PCR, is a filter through which you examine the market’s behavior. No filter is perfect. But layered together intelligently, they help you see what the noise is hiding.
The market doesn’t reward those who read PCR. It rewards those who understand what’s behind it.
Disclaimer: Investments in the securities market are subject to market risks, read all related documents carefully before investing.
Options trading involves substantial risk and may not be suitable for all investors. The information provided in this article is for educational and informational purposes only and should not be construed as investment, trading, or financial advice. Put-Call Ratio (PCR) is only one of many indicators used by traders and should not be relied upon in isolation. Market conditions can change rapidly, and no indicator can guarantee profits or accurately predict future price movements. Readers should conduct their own research and assess their financial situation and risk appetite before making any trading or investment decisions.
FAQs
What is a good PCR ratio for Nifty?
There’s no universal “good” PCR. For Nifty, OI PCR in the 0.9-1.2 range is generally considered neutral. Below 0.8 starts signaling excessive bullishness (potential caution zone), while above 1.3 begins entering fear territory. Context matters far more than the absolute number.
Is high PCR bullish or bearish?
Both; it depends on how high and what else is happening. Conventionally, high PCR (above 1.2-1.3) signals bearish sentiment. But at extremes (above 1.5), it often becomes a contrarian bullish signal because fear is already fully priced in. This is the nuance most traders miss.
Which PCR is more reliable: volume or open interest?
OI PCR is generally more reliable for swing traders. It reflects accumulated positional conviction rather than single-day trading noise. Volume PCR has its uses intraday for sentiment tracking, but it’s prone to distortion from large block trades and institutional hedging activity.
Can PCR predict market reversals?
Not precisely. It can indicate elevated probability zones for reversals -especially when PCR is at historical extremes and coincides with key technical levels. But the timing is not reliable. Many traders lose money trying to time reversals purely on PCR extremes without price confirmation.