

A success rate of more than 92% sounds almost impossible in trading. Yet that is what W.D. Gann reportedly achieved during a closely observed trading test in October 1909.
Over 25 market days, Gann completed 286 trades. According to the published account, 264 trades were profitable, 22 ended in losses, and his trading capital reportedly grew multifolds compared to its original margin during that 25-day test period.
There is one important detail, though. Gann never disclosed the exact method behind those trades, and there is no evidence that the Square of 9 alone produced the results.
The figures come from historical published accounts and are difficult to verify independently today. Therefore, they should not be treated as proof that the Square of 9 has a 92% success rate.
Still, the Square of 9 became one of the most recognised tools associated with Gann’s trading theories. Even today, traders use its spiral of numbers and angular calculations to identify possible support, resistance and target levels in indices such as the Nifty.
So, how does this century-old mathematical tool work, and can it really identify Nifty levels with the accuracy its supporters claim? This blog explains the calculations, applications and limitations of the Gann Square of 9 in simple terms.
Let’s dive in!
What Is a Gann Square?
A Gann Square is a technical analysis tool used to study the relationship between price and time.
A price chart shows price on the vertical axis and time on the horizontal axis. The Gann Square places both measurements within a geometric structure and is usually drawn from an important market high, low or pivot point.
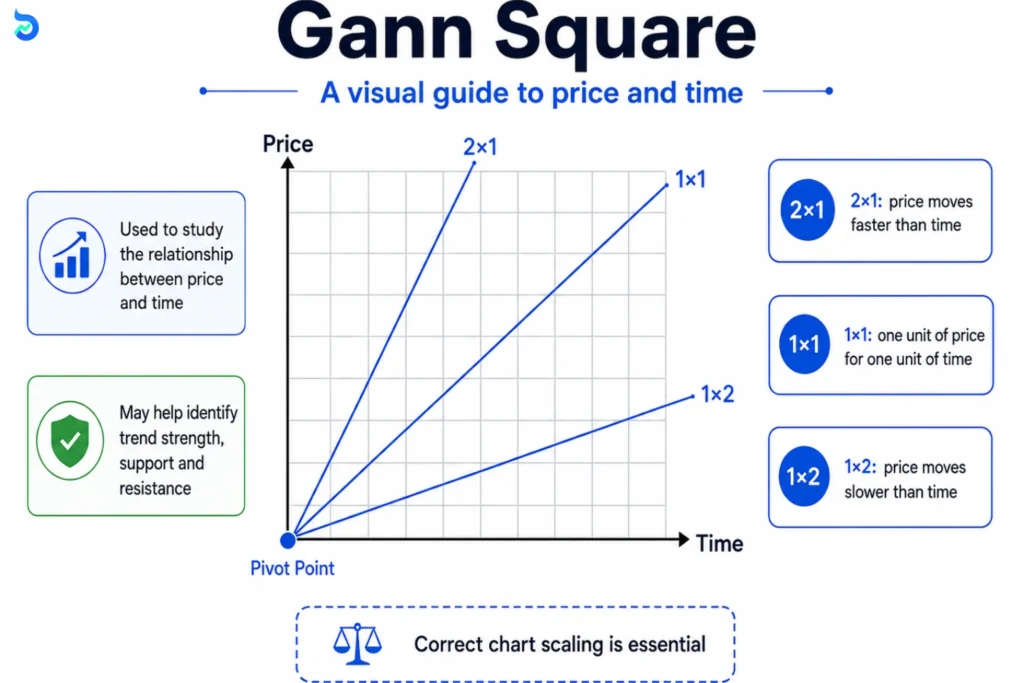
Diagonal lines are then drawn using fixed price-to-time ratios:
- 1×1 line: one unit of price for one unit of time
- 2×1 line: two units of price for one unit of time
- 1×2 line: one unit of price for two units of time
Traders study these lines to understand the direction and strength of a trend. The lines may also indicate possible areas of support, resistance or changes in market direction.
Correct chart scaling is essential. The 1×1 line is often called the 45° line, but it represents the correct price-to-time relationship only when the chart is properly scaled.
In simple terms, the Gann Square shows how price movement relates to the amount of time that has passed. It is different from the Gann Square of 9, which uses a spiral of numbers to calculate possible price levels.
Suggested Read: Ichimoku Cloud Trading Strategy & 7 Crucial Signals for Indian Markets
History of Gann Tools
Who Created Gann Tools?
Gann tools were developed from the ideas of William Delbert Gann, an American trader and market analyst who lived from 1878 to 1955.
He began studying financial markets in the early 1900s. At that time, there were no computers or digital charts. Traders recorded prices by hand and studied market movements on graph paper.

What Did Gann Believe?
Gann believed that market movements were not completely random. He thought that prices could move in repeating patterns based on three main factors:
- Price: How much the market moves
- Time: How long the movement takes
- Angles: The direction and speed of the movement
He used mathematics, geometry, squares, circles and number patterns to study how these factors were connected.
How Were Gann Tools Developed?
Gann created different methods to study price and time. These ideas later became known as Gann tools.
Some of the best-known tools include:
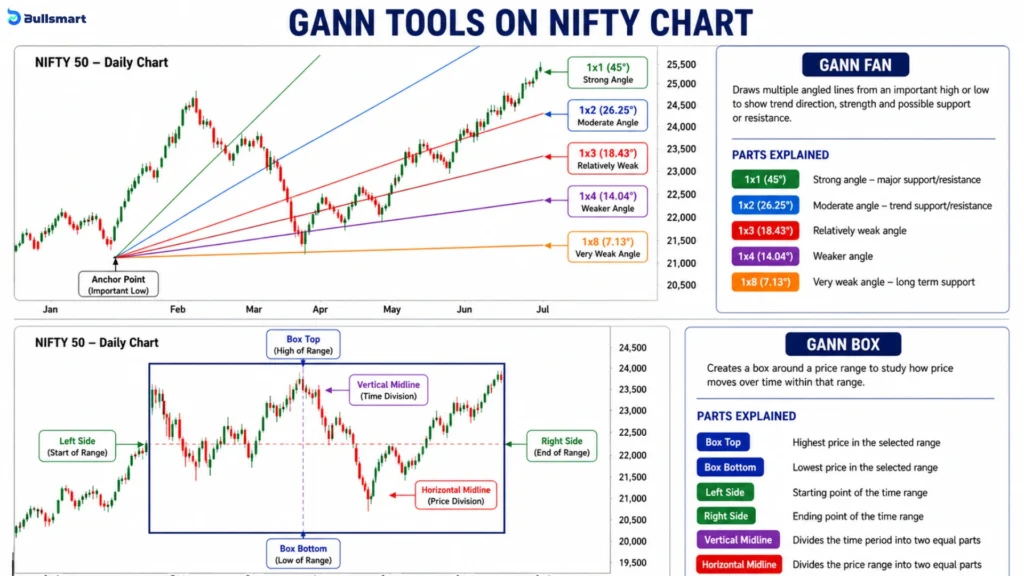
| Gann Tool | Main Purpose |
| Gann Fan | Uses angled lines to study the direction and strength of a trend |
| Gann Box | Studies price and time inside a rectangular area |
| Gann Square | Compares price movement with the passage of time |
| Gann Square of 9 | Uses numbers, square roots and angles to calculate possible levels |
Gann originally calculated and drew these tools by hand.
How Did Gann Share His Methods?
Gann explained his market ideas through books, newsletters and trading courses.
He wrote about topics such as:
- Price and time cycles
- Market angles
- Support and resistance levels
- Repeating market patterns
- Possible market turning points
However, some parts of his methods were not explained in complete detail. Because of this, traders and researchers have interpreted certain Gann techniques in different ways.
How Did Gann Tools Become Digital?
As technology developed, charting platforms converted Gann’s hand-drawn methods into digital tools.
Today, traders can add Gann Fans, Gann Boxes and Gann Squares directly to price charts. Computer programs can also perform calculations that Gann once completed manually.
Suggested Read: The Wyckoff Spring: How Institutions Trap Retail Traders Before Major Rallies & 2 Ways It Happens
What Is the Gann Square of 9?
The Gann Square of 9 is a numerical tool used to calculate possible price levels.
It arranges consecutive numbers in a spiral. The number 1 is placed at the centre, and the remaining numbers move outward around it.
Note: Some traders may also apply the Square of 9 to dates, trading days and market cycles. However, time-based methods use different rules. This blog mainly focuses on using the Square of 9 to calculate price levels.
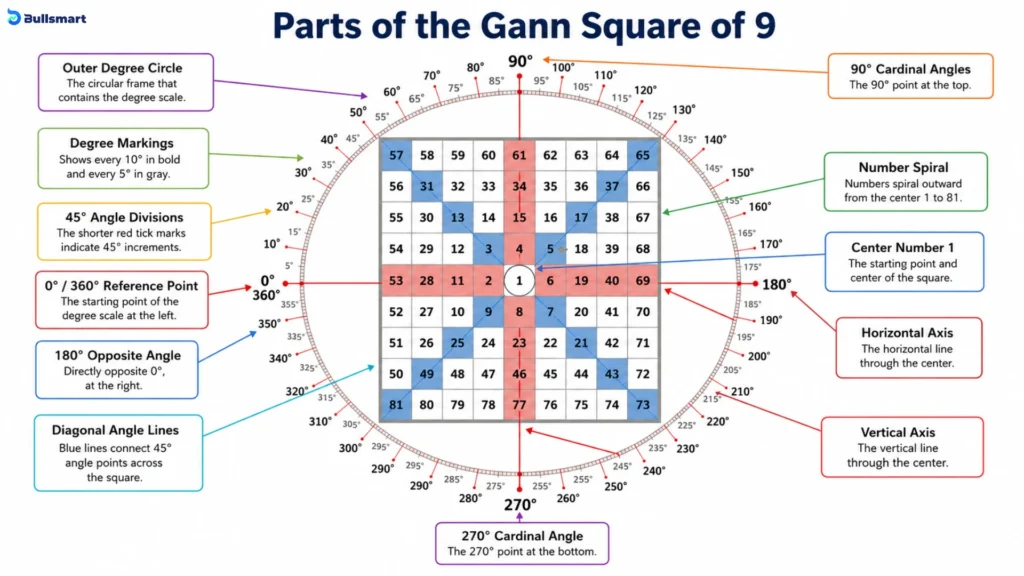
The spiral is divided into angles such as:
- 45°
- 90°
- 180°
- 270°
- 360°
Numbers that appear along the same angle are treated as mathematically connected.
To calculate market levels, a reference price is selected. The square root of that price is calculated. A value linked to a chosen angle is then added or subtracted. The result is squared again to find possible price levels above or below the reference price.
The Gann Square of 9 does not compare price with time on a chart. It mainly uses numbers, angles and square-root calculations to identify possible support, resistance and target levels.
In simple terms, the Gann Square compares price with time, while the Gann Square of 9 compares one price with other mathematically calculated price levels.
Suggested Read: Supertrend Indicator’s 2 Core Components & the Powerful Setting Behind Clearer Signals
Benefits and Limitations of the Gann Square of 9
| Benefits | Limitations |
| Calculates possible levels in advance | Different methods may produce different levels |
| Uses a repeatable mathematical process | Results depend heavily on the chosen starting price |
| Can be applied to different price values | Several possible levels may be created |
| Encourages structured chart observation | It does not predict market direction by itself |
| Helps traders compare price reactions around fixed levels | Past accuracy can sometimes be overstated |
What Is the Square of 9, and Why Is It Important?
The Square of 9 is a number-based Gann tool used to calculate possible price or time levels.
It starts with 1 at the centre. The remaining numbers are placed around it in a spiral, moving outward one number at a time.
Numbers such as 9, 25, 49 and 81 are perfect squares. They appear at important points as the spiral grows. Numbers placed along the same angle, such as 45°, 90° or 180°, are treated as mathematically connected.
The name Square of 9 comes from its early structure, where the first complete square ends at 9.
Its importance comes from the way it connects:
- Numbers
- Square roots
- Angles
- Possible price or time levels
Traders choose a reference price and use these relationships to calculate levels above or below it.
However, these levels are only mathematical reference points. They do not guarantee that the market will stop, reverse or move in a particular direction.
Suggested Read: World’s Most Expensive Trading Terminals: From a Rs. 26 Lakh Bloomberg Terminal to an 8-Monitor Home Rig
How To Use the Square of 9?
The basic process is:
- Choose a reference price
- Select one calculation method
- Calculate the upper and lower levels
- Mark the levels on the chart
- Observe how price behaves near them
- Use separate confirmation before trading
The calculated levels are reference points, not automatic trade signals.
Gann Square vs Gann Square of 9
| Basis | Gann Square | Gann Square of 9 |
| Structure | Geometric grid drawn on a chart | Numbers arranged in a spiral |
| Main comparison | Price in relation to time | A reference price in relation to calculated levels |
| Starting point | Important high, low or pivot | Selected price or central number |
| Key relationships | 1×1, 2×1 and 1×2 ratios | 45°, 90°, 180°, 270° and 360° angles |
| Main use | Studying trends, support, resistance and timing | Calculating potential price levels |
| Key requirement | Correct price-to-time chart scale | Consistent starting price and calculation method |
The two tools are connected through Gann’s use of mathematics, geometry and angles. However, they have different structures and perform different calculations, so they should not be described as the same tool.
The Gann Square of 9 Is Different from Other Gann Tools
Many Gann tools use price, time and angles, so their names can sound similar. However, each tool has a different purpose.
| Tool | What it does | When it can be used |
| Gann Square of 9 | Uses numbers arranged in a spiral to calculate possible price or time levels | When traders want to calculate possible support, resistance or target levels from a selected reference price |
| Gann Square drawing tool | Places price and time together inside a square-shaped chart | When traders want to study whether price movement is in proportion to the time taken |
| Gann Fan | Draws several angled lines from an important high or low | When traders want to study trend direction, trend strength and possible support or resistance along angled lines |
| Gann Box | Studies how price moves over time inside a rectangular box | When traders want to examine price movement and timing within a defined market range |
The Gann Square drawing tool connects price and time on a chart. Traders usually draw it from an important point, such as a major high, major low or market turning point.
For the tool to work properly, the chart must be scaled correctly. This means the price movement and the passage of time must be shown in the right proportion.
The Gann Square of 9 works in a different way. It starts with a reference price and uses square roots and angle-based calculations to find other numerical price levels. It does not require price and time to be drawn together on a chart.
History of the Gann Square of 9
The exact date when Gann developed the Square of 9 is not clearly documented.
The tool became closely connected with his use of numbers, angles and repeating cycles. It arranges consecutive numbers in a spiral, starting with 1 at the centre.
Traders use mathematical relationships within this spiral to calculate possible price or time levels.
The Main Idea Behind Gann Tools
The basic idea behind Gann’s work was simple: Price and time may move in repeating mathematical patterns.
Gann tools were created to help traders identify and study these patterns. However, they do not predict market movements with certainty and should not be treated as guaranteed trading systems.
Suggested Read: RSI Divergence in Nifty Options: Meaning, Signals & 7 Common Mistakes
How the Gann Square of 9 Calculation Works
The basic calculation has four steps.
Step 1: Choose a Starting Price
The starting price is also called the reference price or anchor price.
Depending on the method, traders may choose:
- A major swing high
- A major swing low
- An opening price
- A closing price
- A weighted average price
- The last traded price
The starting price is very important because every calculated level depends on it.
Changing the starting price will change all the final levels.
For example, some intraday calculators use the last traded price or weighted average price after the market opens. Other Gann-based charting tools begin from an important high, low or turning point.
These methods use different starting points, so they may produce different results.
Step 2: Find the Square Root
Let the starting price be P.
First, calculate: √P
This converts the original price into a smaller number that can be adjusted using an angle.
Step 3: Add or Subtract the Angle Adjustment
In a commonly used Square of 9 method, every 45° movement changes the square root by 0.25.
| Angle | Adjustment |
| 45° | 0.25 |
| 90° | 0.5 |
| 135° | 0.75 |
| 180° | 1 |
| 225° | 1.25 |
| 270° | 1.5 |
| 315° | 1.75 |
| 360° | 2 |
To calculate a possible upper level, add the adjustment.
To calculate a possible lower level, subtract the adjustment.
For example:
- For 90°, add or subtract 0.50
- For 180°, add or subtract 1.00
- For 360°, add or subtract 2.00
Step 4: Square the New Number
After adding or subtracting the adjustment, square the result.
The formulas are:
Upper level = (√P + θ ÷ 180)²
Lower level = (√P − θ ÷ 180)²
Here:
- P means the starting price
- θ means the selected angle
- θ ÷ 180 gives the square-root adjustment
For example, if the selected angle is 90°: 90 ÷ 180 = 0.50
So the calculation becomes:
Upper level = (√P + 0.50)²
Lower level = (√P − 0.50)²
These calculations produce possible price levels based on the Square of 9 method.
However, they do not prove that the market will reverse or react at those levels. They are mathematical reference points, not guaranteed predictions.
A Simple Gann Square of 9 Calculation Using Nifty
This example uses 25,000 only to explain the calculation. It is not a market forecast, trading signal or recommendation.
Step 1: Choose the Starting Value
Let the starting value be: P = 25,000
Step 2: Find the Square Root
Calculate the square root of 25,000: √25,000 = 158.1139
This number will be adjusted according to the selected angle.
Step 3: Calculate the Upper and Lower Levels
| Angle | Calculated upper level | Calculated lower level |
| 45° | 25,079.12 | 24,921.01 |
| 90° | 25,158.36 | 24,842.14 |
| 180° | 25,317.23 | 24,684.77 |
| 360° | 25,636.46 | 24,371.54 |
Example: 90° Upper Level
A 90° angle uses an adjustment of 0.50.
Add 0.50 to the square root and square the result:
(158.1139 + 0.50)² = 25,158.36
So, the calculated 90° upper level is: 25,158.36
Example: 90° Lower Level
Subtract 0.50 from the square root and square the result:
(158.1139 − 0.50)² = 24,842.14
So, the calculated 90° lower level is: 24,842.14

What Do These Levels Mean?
Once the starting value, angle and formula are selected, the calculation produces fixed numbers.
However, the meaning of those numbers is not fixed.
A calculated level is only a possible price reference. It does not automatically become:
- Support
- Resistance
- A price target
- An entry point
- An exit point
The market may react near a level, move through it or ignore it completely. A price touching the level also does not prove that the Square of 9 correctly predicted the market’s direction.
Fictional Gann Square of 9 Calculation Simulator
This fictional simulator is designed only to explain the arithmetic behind one commonly used Square of 9 convention. It does not use live market data, generate forecasts, identify support or resistance, or provide entries, exits, targets or recommendations.
Choose a Reference Value
The input is commonly called the reference price or anchor price. For this demonstration, it is simply the numerical value represented by P.
Changing P changes every calculated output. Selecting a different label without changing P does not affect the arithmetic.
Find the Square Root
Calculate the square root of the selected price.
This creates a smaller number that can be adjusted using an angle.
Add or Subtract the Angle Adjustment
Under the convention used in this simulator, divide the selected angle by 180 to find the square-root adjustment.
| Angle | Adjustment |
|---|
Square the New Number
Why Do Different Gann Calculators Produce Different Levels?
Different calculators may show different results because they use:
- Different starting prices
- Different angle adjustments
- Different calculation formulas
- Different timeframes
- Different rounding methods
- Different intraday or long-term calculation rules
Because these settings can change, there is no single fixed value that can always be called “the Gann level.”
Why Can Gann Levels Look Very Accurate?
Gann levels may appear accurate for several reasons:
- They are calculated beforehand: Once the starting price and formula are chosen, the levels remain fixed.
- Many levels are created: More calculated levels increase the chance that price will move close to one of them.
- Accuracy may not be clearly defined: A level may be called accurate even when the price does not touch it exactly.
- The starting price may be selected later: Choosing the best starting point after seeing the full chart can make past results look stronger.
- Other market levels may be nearby: Gann levels may fall close to previous highs, lows, round numbers or option strike prices that traders are already watching.
A price reaction near a Gann level does not automatically prove that the Gann calculation caused it.
How Can Traders Test Gann Levels Properly?
Before testing, traders should set clear rules for:
- The starting price
- The calculation method
- The angles being tested
- What counts as a price reaction
- How close price must come to the level
- How long each level stays valid
- The entry and exit rules
- Brokerage, taxes and other costs
The test should also include unsuccessful results, such as:
- Levels that price never reached
- Levels crossed without any reaction
- False breakouts
- Stop-losses being triggered
- Trades that lost money after costs
Traders may also combine Gann levels with trend, volume, volatility, moving averages or previous highs and lows.
However, all rules should be decided before testing. They should not be changed later just to make past results look better.
Common Gann Square of 9 Mistakes and How to Avoid Them
- Confusing it with other Gann tools: Learn the difference between the Square of 9, Gann Fan, Gann Box and Gann Square drawing tool before using them.
- Choosing the starting price after seeing the chart: Select the anchor price before checking what happens next.
- Mixing different angle methods: Use one angular convention throughout the calculation.
- Treating every level as important: Focus only on the levels included in your testing rules.
- Calling a nearby touch accurate: Decide in advance how close price must come to a level.
- Using levels as automatic signals: Look for other confirmation before making a trading decision.
- Ignoring trading conditions and costs: Include volatility, gaps, brokerage, taxes and slippage in the test.
- Showing only successful examples: Record failed levels and losing trades as well.
- Using the wrong chart scale: For chart-based Gann tools, make sure price and time are correctly matched.
Bottom Line
The Gann Square of 9 may look mysterious at first, but its basic idea is quite simple. It starts with a reference price, uses a square-root adjustment linked to an angle, and then calculates possible levels above and below that price.
What matters most is how the tool is used. Different calculators may follow different formulas, choose different starting prices or apply different angle values. That is why two traders can use the same tool and still get different results.
The calculated levels should not be treated as automatic support, resistance, targets or trade signals. Price may react near them, cross them or ignore them completely. A level looking accurate on a past chart does not prove that it will work again.
The sensible approach is to set clear rules, test the method fairly and record both successful and failed levels. Trading costs, volatility, gaps and false breakouts should also be included.
In the end, the Gann Square of 9 is best viewed as a mathematical market-analysis tool, not a prediction machine. It may offer useful reference points, but it cannot replace risk management, proper testing or independent judgement.
Disclaimer: This article is for educational and informational purposes only. It does not constitute investment advice, a trading recommendation, or a guarantee of future market performance. The Gann Square of 9 is a technical analysis method, and its calculated levels may not always be accurate. Trading and investing involve market risk, including the possible loss of capital. Readers should conduct their own research, consider their financial situation and risk tolerance, and consult a qualified financial adviser before making any investment or trading decision.
FAQs
What is a Gann Square of 9 course?
A Gann Square of 9 course teaches how the Gann Square of 9 trading tool works. It explains how numbers are arranged in a spiral, how angles and square roots are used, and how possible price levels are calculated. It may also show how traders place these levels on a chart and test them.
What is the Gann Square of 9 chart?
The Gann Square of 9 chart is a number grid arranged in a spiral. It starts with 1 at the centre, and the other numbers move outward around it. Traders use angles such as 45°, 90° and 180° to study mathematical relationships between the numbers and calculate possible price or time levels.
What is the Gann Square of 9 used for?
The Gann Square of 9 is used to calculate possible price levels above and below a chosen starting price. Traders may watch these levels as possible support, resistance or reaction areas. Some traders also use the method to study time cycles. However, it does not give automatic buy or sell signals.
How accurate is the Gann theory?
Gann theory does not have a fixed or scientifically proven accuracy rate. Its results depend on the starting price, angle, formula, timeframe and testing method used. Some levels may appear accurate, while others may fail. For this reason, Gann methods should be tested carefully and not treated as guaranteed market predictions.