
The Supertrend indicator looks almost too simple to get wrong.
One line changes colour to show whether the market trend appears bullish or bearish. Price above the line suggests strength. Price below it signals weakness. For traders overwhelmed by complicated charts, Supertrend feels refreshingly straightforward.
But following every colour change can quickly lead to trouble.
In sideways markets, the indicator may flip repeatedly, generate false signals and trigger unnecessary trades. Its usefulness depends heavily on two settings: the ATR period and the multiplier.
The multiplier is especially important because it controls how closely the Supertrend line follows the price and how much market noise it filters. Change it, and the same chart can produce very different signals.
So, what is the best Supertrend setting, and can one multiplier make the indicator more reliable?
Let’s find out!
What Is Supertrend Indicator?
Supertrend is a trend-following indicator placed directly on a price chart.
It uses recent price volatility to calculate a line that appears either below or above the market price.
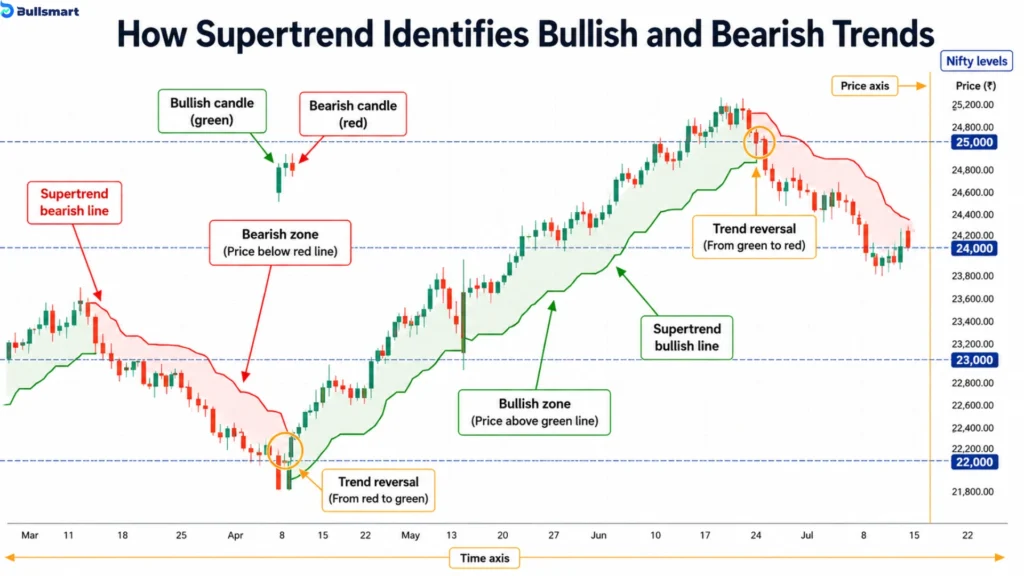
When the line is below the price, Supertrend shows a bullish trend. When the line is above the price, it shows a bearish trend.
A candle closing on the opposite side of the line can cause the indicator to change direction.
The important term here is “trend-following.”
Supertrend does not predict a reversal before it happens. It responds after price has moved enough to challenge the current trend. It is designed to help traders follow an existing move, not forecast the next candle.
A green Supertrend line does not guarantee that the price will rise. It only shows that the current price movement meets the indicator’s conditions for an uptrend.
Suggested Read: Ichimoku Cloud Trading Strategy & 7 Crucial Signals for Indian Markets
The Two Components Behind Supertrend: ATR Period and Multiplier
Supertrend is built using two inputs: the ATR period and the multiplier. Trading platforms calculate both automatically, but understanding them helps you see why the line changes position and why different settings produce different signals.
Average True Range
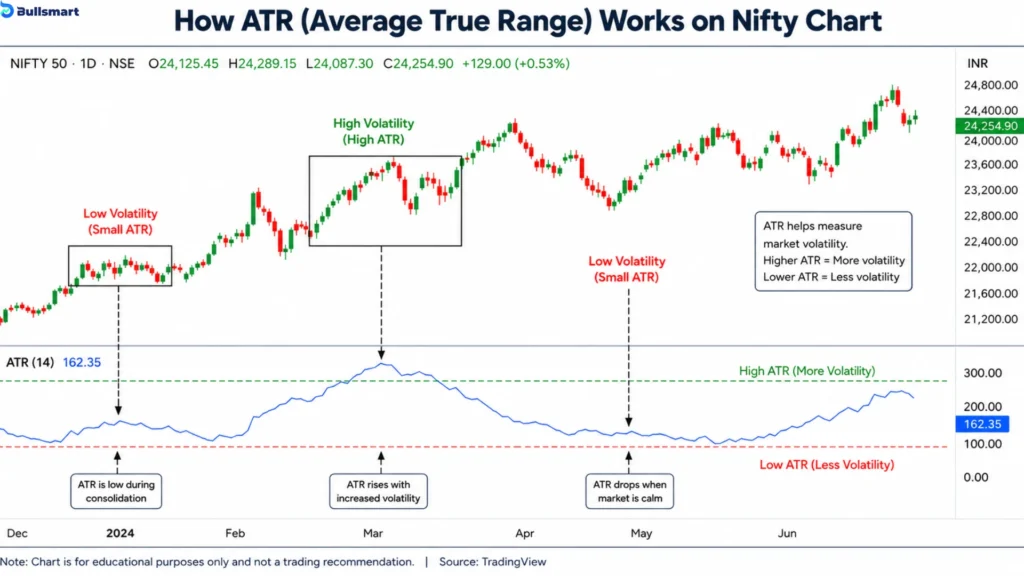
ATR stands for Average True Range. It measures how much the price has been moving over a selected number of candles. It measures volatility, not direction.
The calculation begins with the True Range:
True Range = Highest of the following three values:
- Current high minus current low
- Absolute value of current high minus previous close
- Absolute value of current low minus previous close
Using the highest value allows ATR to account for price gaps between trading sessions.
Once the True Range has been calculated, ATR can be determined using Wilder’s smoothing formula:
ATR = [(Previous ATR × (n − 1)) + Current True Range] ÷ n
Where:
- Previous ATR = ATR calculated for the previous candle
- n = Number of periods selected
- Current True Range = True Range of the latest candle
When there is no previous ATR, the first value is calculated as the average of the True Range values for the selected period:
Initial ATR = Sum of True Range values over n periods ÷ n
The ATR period determines how many candles are considered.
A shorter ATR period gives greater weight to recent volatility. This makes Supertrend react more quickly when market conditions change. A longer ATR period includes more historical data and normally produces a smoother, slower-moving reading.
Periods such as 7, 10 and 14 are commonly used, but no single period is suitable for every instrument or timeframe.
Upper and Lower Supertrend Bands
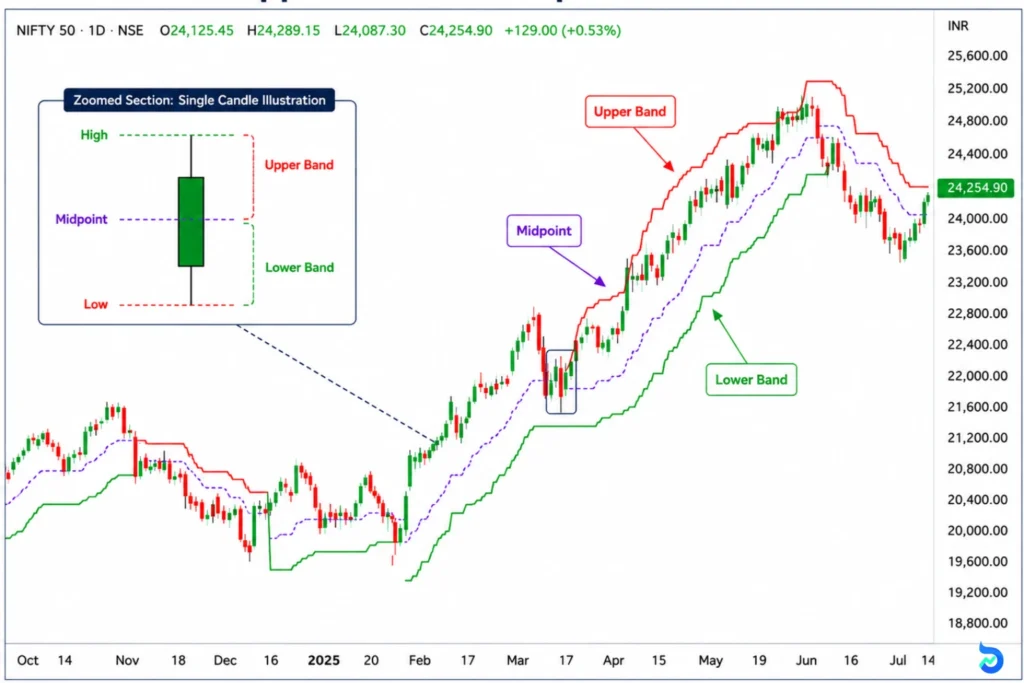
Once ATR has been calculated, Supertrend uses it to create an upper band and a lower band.
The basic formulas are:
Midpoint = (High + Low) ÷ 2
Upper band = [(High + Low) ÷ 2] + (Multiplier × ATR)
Lower band = [(High + Low) ÷ 2] − (Multiplier × ATR)
Where:
- High = Highest price recorded during the candle
- Low = Lowest price recorded during the candle
- ATR = Recent market volatility
- Multiplier = The value used to control the distance between the price and the bands
The midpoint of the candle is calculated first by adding its high and low and dividing the result by two. The ATR is then multiplied by the selected multiplier and added to or subtracted from that midpoint.
Supertrend also compares these basic bands with previous band values and closing prices. This prevents the active line from moving in a way that would weaken the existing trend unnecessarily.
During a bullish trend, the lower band generally becomes the visible Supertrend line below the price. During a bearish trend, the upper band becomes the visible line above the price.
Suggested Read: The Wyckoff Spring: How Institutions Trap Retail Traders Before Major Rallies & 2 Ways It Happens
How the Multiplier Affects Supertrend Signals
The multiplier controls how far the Supertrend line is placed from the price. It does not determine whether the market will rise or fall. It only changes how much price movement is required before the indicator changes its trend reading.
When the multiplier is lower, the Supertrend line stays closer to the price. Even a relatively small price movement can cause the line to switch from below the price to above it, or the other way around.
A lower multiplier generally results in:
- More frequent trend changes
- More buy and sell signals
- Faster responses to price movements
- Greater sensitivity to short-term volatility
- A higher possibility of repeated signals in sideways markets
When the multiplier is higher, the Supertrend line is positioned farther from the price. A larger price movement is then required before the indicator changes direction.
A higher multiplier generally results in:
- Fewer trend changes
- Fewer signals
- Wider distances between the price and the Supertrend line
- Longer periods before the indicator registers a reversal
- Greater tolerance for ordinary pullbacks within an existing trend
The difference can be understood through the distance of the bands. If ATR is ₹10, a multiplier of 1 places the bands ₹10 away from the candle’s midpoint. A multiplier of 3 places them ₹30 away.
This does not mean that the higher multiplier produces a more accurate prediction. It simply makes Supertrend less responsive to smaller price movements. Similarly, a lower multiplier is not automatically better for early signals. Its greater sensitivity can also cause the trend reading to change when the price is only moving within its normal range.
Therefore, the multiplier mainly controls the indicator’s sensitivity. A lower value makes Supertrend react more quickly, while a higher value requires a stronger price movement before the trend reading changes.
Suggested Read: Straddle vs Strangle on Nifty: How VIX Can Guide the Choice
How Supertrend Identifies Bullish and Bearish Trends
- Bullish trend: When the price moves above the Supertrend line, the indicator shows a bullish trend.
- Bearish trend: When the price falls below the Supertrend line, the indicator shows a bearish trend.
- Colour change: The line usually turns green during a bullish trend and red during a bearish trend.
- Support and resistance: In an uptrend, the line may act as support. In a downtrend, it may act as resistance.
- Trend reversal: A shift from one side of the price to the other may indicate a possible trend change.
- Signal confirmation: Traders often wait for the candle to close above or below the line before treating it as a signal.
Why Is Supertrend So Popular?
Supertrend removes a lot of visual clutter from the chart.
Instead of reading several lines at once, traders can use one volatility-adjusted line to identify the current trend.
It is popular for a few practical reasons.
It Makes Trend Direction Easy to Read
The position of the line immediately shows whether the indicator considers the market bullish or bearish.
This makes Supertrend easier for beginners to understand than many indicators with several moving parts.
It Adjusts to Volatility
Supertrend does not use a fixed rupee or percentage distance.
Its bands expand when volatility increases and contract when volatility decreases. This helps the indicator adjust to changing market conditions.
It Can Be Used as a Trailing Reference
During a bullish move, the line below the price can help traders track whether the trend is still intact.
As the price rises, the line can move higher. This makes it useful as a trailing exit reference.
The same principle applies during a bearish trend, with the line appearing above the price.
This does not mean that every stop-loss order should be placed exactly at the Supertrend line. Position size, liquidity, slippage and individual risk limits still matter.
It Works Across Different Timeframes
Supertrend can be added to intraday, daily and weekly charts.
It can also be used across stocks, indices, futures, commodities, currencies and cryptocurrencies.
But the same setting will not behave the same way everywhere. A setting used on a daily equity chart cannot be assumed to work equally well on a five-minute index chart.
Limitations of the Supertrend Indicator
Before using the Supertrend indicator, traders should understand its limits:
- It gives late signals: Supertrend follows price movements instead of predicting them. This means the buy or sell signal may appear after the price has already moved.
- It can give false signals: In a sideways market, the indicator may switch between bullish and bearish signals many times. This can lead to unnecessary trades and losses.
- Settings can be confusing: Traders must choose the right ATR period and multiplier. A very low setting may produce too many signals, while a high setting may react too slowly.
- It should not be used alone: Supertrend only shows the possible trend direction. It works better when used with indicators such as RSI, moving averages or volume.
- It does not work well in every market: The indicator is more useful in trending markets. It may be less effective when prices move within a fixed range.
- Short-term signals can be unreliable: Small price movements and market noise can affect Supertrend on shorter charts.
- It does not show trend strength: Supertrend tells you the direction of a trend, but not how strong it is.
- Results may vary: The indicator may perform differently across stocks, indices, commodities and market conditions.
Know Your Popular Technical Indicators
| Indicator | Measures | Key Components | Primary Use | Time Frame |
| Average Directional Index (ADX) | Trend strength | ADX line, +DI and -DI | Measures how strong a trend is | Medium to long term |
| Average True Range (ATR) | Volatility | ATR line | Measures volatility and helps place stop-loss orders | Any time frame |
| Bollinger Bands | Volatility | Middle SMA, upper band and lower band | Identifies possible overbought or oversold levels and breakouts | Short to medium term |
| Commodity Channel Index (CCI) | Momentum | CCI line | Identifies overbought or oversold conditions and trend strength | Short to medium term |
| Fibonacci Retracement Levels | Price levels | 23.6%, 38.2%, 50% and 61.8% levels | Finds possible support, resistance and reversal points | Any time frame |
| Ichimoku Cloud | Trend | Tenkan-sen, Kijun-sen, Senkou Span A and B, Chikou Span | Shows trend direction, momentum, support and resistance | Medium to long term |
| Moving Average (MA) | Trend | Simple Moving Average and Exponential Moving Average | Identifies trends and possible support or resistance | Any time frame |
| Moving Average Convergence Divergence (MACD) | Momentum | Fast EMA, slow EMA and signal line | Shows trend direction, momentum and possible reversals | Medium to long term |
| On-Balance Volume (OBV) | Volume | Cumulative volume line | Confirms price trends and signals possible reversals | Any time frame |
| Parabolic SAR | Trend | SAR dots | Shows trend direction and possible exit or reversal points | Short to medium term |
| Relative Strength Index (RSI) | Momentum | Overbought and oversold levels | Identifies possible overbought, oversold and reversal conditions | Short to medium term |
| Stochastic Oscillator | Momentum | %K line and %D line | Measures momentum and identifies overbought or oversold levels | Short term |
What the Nifty 500 Backtest Found
A 2026 Share Market study tested more than 200,000 Supertrend trades across Nifty 500 stocks.
The research used daily closing candles from 2012 to 2025. It tested ATR periods ranging from 3 to 21 and multipliers ranging from 1 to 3.
For an ATR period of 3, the study reported the following results:
| Setting | Average Win | Average Loss | Win Rate |
| 3,1.0 | 8.54% | -3.64% | 40.70% |
| 3,1.5 | 11.69% | -4.69% | 41.10% |
| 3,3.0 | 25.53% | -7.40% | 42.90% |
The win rate did not increase dramatically as the multiplier rose.
The larger difference appeared in the average winning trade.
With the 3,3 setting, the reported average win was 25.53%, compared with 8.54% for the 3,1 setting.
The wider multiplier also produced far fewer trades. The study reported approximately 65,000 trades at lower multipliers and around 15,000 at higher multipliers.
This suggests that the wider setting filtered out many smaller trend changes and remained in successful trades for longer.
It also created a larger average loss. The average loss increased from 3.64% with the 3,1 setting to 7.40% with the 3,3 setting.
That is the trade-off.
The higher multiplier allowed winning trends more room to develop, but it also allowed losing positions to move farther before the exit signal appeared.
Is 3,3 the Best Supertrend Setting?
The 3,3 setting performed best according to one measure used in the Share.Market study. It recorded the highest expected value per trade per day in that dataset.
But this does not prove that 3,3 is the best setting for every trader.
The study used daily candles. The reported average holding period for the 3,3 setting was approximately 69 days.
That makes the result more relevant to positional or medium-term trend following than rapid intraday trading.
A trader using five-minute candles cannot directly apply the same conclusion. The amount of noise, number of signals, transaction costs and holding period would be completely different.
The published research also does not provide every detail required for a fully reproducible backtest.
It does not clearly disclose the complete treatment of:
- Brokerage
- Slippage
- Securities Transaction Tax
- Other transaction charges
- Position sizing
- Survivorship bias
- Delisted stocks
- Liquidity
- Corporate actions
These limitations do not make the study meaningless. They simply mean the results should be treated as evidence worth investigating, not as guaranteed performance.
The correct takeaway is not “3,3 always works.”
The correct takeaway is that a wider multiplier may improve trend capture by reducing unnecessary exits.
Why Supertrend Struggles in Sideways Markets
Supertrend works best when the market is moving consistently in one direction.
It struggles when price repeatedly moves above and below the same range.
In a sideways market, the price may cross the Supertrend line several times without developing a meaningful trend.
The indicator turns bullish. Price reverses. The indicator turns bearish. Price reverses again.
This repeated flipping is called a whipsaw.
Whipsaws can lead to frequent entries and exits. Even when individual losses are small, brokerage, taxes, slippage and repeated poor trades can damage the overall result.
A higher multiplier may reduce some of these false signals because the line sits farther from the price. However, no multiplier can convert a directionless market into a strong trend.
Supertrend identifies trend direction. It does not measure trend strength.
This is why traders often combine it with another tool rather than relying on it alone.
How Beginners Can Use Supertrend More Carefully
Choose the Timeframe First
The timeframe should be selected before the setting.
A trader holding positions for several weeks has different requirements from someone trading five-minute candles.
The expected holding period, level of noise and number of signals all change with the timeframe.
Start With a Benchmark
The 10,3 setting is commonly used as a starting point on many platforms.
It combines a 10-period ATR with a multiplier of 3.
The 3,3 setting can also be tested on daily data because of the results reported in the Nifty 500 study.
Neither setting should be treated as automatically profitable.
Wait for the Candle to Close
The price can cross the Supertrend line before the candle is complete and move back before the candle closes.
Acting during the unfinished candle can lead to false entries or exits.
Waiting for the closing price provides confirmation that the crossover remained in place at the end of the period.
This does not eliminate false signals, but it can reduce reactions to temporary price movement.
Add One Independent Filter
Supertrend can be combined with another indicator that measures something different.
Useful options include:
- A moving average for broader trend direction
- ADX for trend strength
- RSI for momentum
- MACD for momentum and trend confirmation
- Volume for market participation
- Support and resistance for price context
The aim is not to fill the chart with indicators.
One clear filter is usually more useful than several tools giving similar information.
Backtest the Exact Rules
A Supertrend setting should be tested using clear entry and exit conditions.
The test should specify:
- Instrument
- Timeframe
- ATR period
- Multiplier
- Entry rule
- Exit rule
- Confirmation filter
- Risk per trade
- Transaction costs
The results should include:
- Total trades
- Win rate
- Average win
- Average loss
- Maximum drawdown
- Holding period
- Net return after costs
Win rate alone is not enough.
A strategy can win less than half the time and still make money when its average winners are much larger than its average losses.
It can also record a high win rate and lose money if occasional losses are too large.
Adjust the Position Size
A higher multiplier usually creates a wider distance between the entry price and the Supertrend line.
That increases the potential loss per share.
Traders using a wider stop may need to reduce their position size to keep the total rupee risk within their limit.
The multiplier and position size should be planned together.
Advantages and Disadvantages of the Supertrend Indicator
| Aspect | Advantage | Disadvantage |
| Ease of use | The indicator is simple to read because the line appears below the price in a bullish trend and above it in a bearish trend. | Its simplicity may encourage traders to treat every colour change as a direct buy or sell instruction. |
| Trend identification | It provides a clear visual indication of the prevailing trend direction. | It shows direction but does not indicate whether the trend is strong, weak or likely to continue. |
| Volatility adjustment | Supertrend uses ATR, so the distance of the line changes according to recent market volatility. | Sudden changes in volatility can widen or narrow the bands and affect the timing of signals. |
| Signal timing | A lower multiplier can make the indicator respond quickly to price movements. | Faster settings can react to ordinary market noise and produce frequent false signals. |
| Trend retention | A higher multiplier gives the price more room to move and may keep the trend reading unchanged during normal pullbacks. | Wider settings can delay the identification of an actual reversal and result in a later exit. |
| Sideways markets | It can clearly highlight directional movement when a sustained trend develops. | It may repeatedly switch between bullish and bearish readings when the market moves within a narrow range. |
| Trailing reference | The active line can provide a moving reference for tracking whether the existing trend remains intact. | The Supertrend line may be too wide or too narrow to function as a suitable exit level for every trade. |
| Chart readability | It combines volatility and trend direction into one line, reducing chart clutter. | It does not provide information about volume, momentum, support, resistance or broader market conditions. |
| Flexibility | It can be applied to stocks, indices, futures, currencies, commodities and cryptocurrencies across multiple timeframes. | The same ATR period and multiplier can produce very different results across instruments and timeframes. |
| Rule-based interpretation | A closing price crossing the active line provides a defined condition for a possible trend change. | The signal appears only after price has moved, making Supertrend a lagging indicator. |
| Setting customisation | The ATR period and multiplier allow the indicator’s sensitivity to be adjusted. | There is no universal setting that performs consistently across all market conditions. |
| Predictive ability | It helps organise and interpret existing price movement. | It does not predict future prices or guarantee that the trend will continue after a signal appears. |
Bottom Line
Supertrend is popular because it makes trend direction easier to understand without turning the chart into a mess. But that simplicity can also be misleading. A green or red line does not tell you what the market will do next. It only shows how the price is behaving based on the indicator’s current settings.
The multiplier plays a major role in how quickly Supertrend reacts. A lower value gives more frequent signals, while a higher value allows more room for normal price movement before the trend changes. The 3,3 setting delivered strong results in one Nifty 500 backtest, but that does not make it the best setting for every stock, market or timeframe.
That is really the point. Supertrend can help bring more structure to trend analysis, but it works best when you understand its limits. No setting can remove market risk, and no colour change should be treated as a guaranteed trade signal.
Disclaimer: This blog is intended only for educational and informational purposes. It should not be treated as investment advice, a trading recommendation or an assurance of returns. Technical indicators such as Supertrend are based on historical price data and may produce false or delayed signals. Backtest results do not guarantee future performance. Trading and investing involve market risk, including the possible loss of capital. Readers should conduct independent research and consult a qualified financial adviser before making financial decisions.
FAQs
Which Supertrend indicator is best?
There is no single Supertrend setting that is best for every market or timeframe. The commonly used 10,3 setting balances responsiveness and noise filtering, while 3,3 performed strongly in one Nifty 500 daily-candle backtest. However, results change across instruments, holding periods and market conditions. A suitable setting must be tested against clearly defined trading rules and costs over time.
Does Supertrend actually work?
Supertrend can work as a structured way to identify and follow an existing trend, but it does not predict future prices. It tends to be more useful during sustained directional moves and less reliable in sideways markets, where repeated flips can occur. Its effectiveness depends on the settings, timeframe, instrument, transaction costs, risk controls and the rules used alongside it.
What is Supertrend 7,3?
Supertrend 7,3 means the indicator uses a seven-period Average True Range and a multiplier of three. The ATR looks at volatility across the latest seven candles, while the multiplier places the bands three ATR units from the candle midpoint. This combination affects signal sensitivity, but its behaviour still varies depending on the instrument, chart timeframe and current market conditions considerably.
How to avoid Supertrend false signals?
False Supertrend signals cannot be removed completely, but they can be reduced by avoiding every intrabar crossover, checking the candle close and recognising sideways markets. Traders also compare the signal with trend strength, momentum, volume, support or resistance. Testing the settings on a specific instrument and timeframe shows how often false signals occurred historically once costs and slippage are included.