
If the Ichimoku Cloud has ever looked like a mess of lines and colours, you are not alone. Many beginners open the chart, see the cloud, and immediately assume it is too technical to understand. It is not.
This guide breaks the Ichimoku Cloud Trading Strategy into simple, practical parts without drowning you in formulas. You will learn what the five lines mean, which seven signals traders watch most closely, and how these signals come together in a basic trading setup.
We will also look at how traders use Ichimoku on Indian stocks and indices, what makes a signal stronger, and when the setup can become unreliable. By the end, you should be able to look at the chart and understand what it is trying to show instead of guessing.
One thing to remember from the start: no indicator can predict every market move. Ichimoku can support your analysis, but it should always be used with risk management, proper confirmation, and a clear trading plan before risking any real money.
Let's clear the doubts!
What Is the Ichimoku Cloud?
The Ichimoku Cloud is a technical indicator placed directly over a price chart. It helps traders study whether the market is moving upward, falling, or trading without a clear direction.
The indicator combines trend, momentum, support, resistance, and possible trading signals on a single chart. It studies price behaviour using historical highs, lows, and closing prices. However, it does not assess a company's financial strength, profitability, management, or valuation.
What Does the Word "Ichimoku" Mean?
The indicator is also known as Ichimoku Kinko Hyo. The Japanese term roughly translates to "one-glance equilibrium chart".
The name reflects the purpose of the indicator: to help traders understand the overall market condition by looking at one chart.
Origin of Ichimoku Trading Strategy
The Ichimoku trading strategy originated in Japan and was developed by Japanese journalist Goichi Hosoda.
He spent several years testing and refining the system before publishing it in 1969.
The strategy was designed to make market trends and price balance easier to study without relying on several separate indicators.
Why Do Traders Use Ichimoku?
Traders use the Ichimoku Cloud because it can help them:
Identify whether the broader trend is bullish, bearish, or sidewaysMeasure short-term and medium-term price momentumSpot possible support and resistance zonesFind potential entry and exit signalsConfirm whether a breakout has enough strengthStudy current conditions and the projected cloud togetherAvoid taking trades when the market direction is unclear
Price above the cloud may suggest bullish conditions, while price below it may indicate bearish conditions. The cloud projected ahead can also highlight possible future support and resistance zones.
This makes the indicator useful for studying Indian stocks, indices, and other actively traded markets.
Here is the full section with a clear numerical example for every Ichimoku line.
Suggested Read: The Wyckoff Spring: How Institutions Trap Retail Traders Before Major Rallies & 2 Ways It Happens
What Are the Five Parts of the Ichimoku Cloud?
The Ichimoku Cloud has five main lines. Each line shows a different part of price movement.
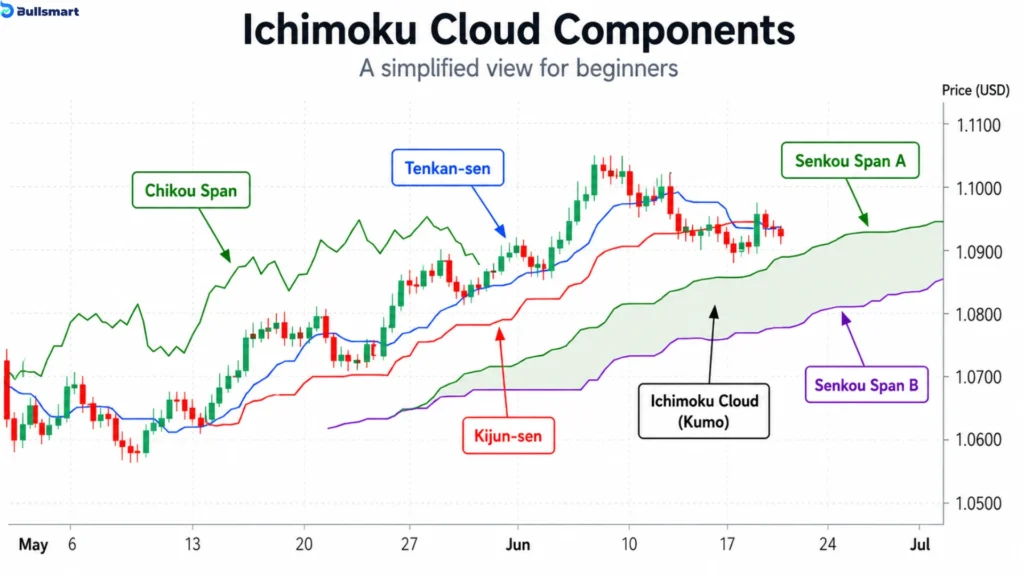
The Ichimoku period means one candle on the chart. On a daily chart, for example, 9 periods means 9 trading days.
| Ichimoku Line | Simple Name | What It Shows |
| Tenkan-sen | Conversion Line | Short-term price direction |
| Kijun-sen | Base Line | Medium-term price direction |
| Senkou Span A | Leading Span A | The faster side of the cloud |
| Senkou Span B | Leading Span B | The slower side of the cloud |
| Chikou Span | Lagging Span | How the current price compares with past prices |
1. Tenkan-sen or Conversion Line
The Tenkan-sen shows short-term price movement.
It finds the middle point between the highest and lowest prices recorded during the last 9 periods. Since it uses fewer periods, it reacts quickly when the price changes.
A rising Tenkan-sen may show short-term upward momentum, while a falling Tenkan-sen may show short-term downward momentum. A flat line may mean that the price is moving within a limited range.
Formula:
Tenkan-sen = (Highest high over 9 periods + Lowest low over 9 periods) / 2
Calculation example:
Suppose the highest price during the last 9 trading days was Rs. 120 and the lowest price was Rs. 100.
Tenkan-sen = (Rs. 120 + Rs. 100) / 2
Tenkan-sen = Rs. 220 / 2
Tenkan-sen = Rs. 110
Therefore, the Tenkan-sen value is Rs. 110.
2. Kijun-sen or Base Line
The Kijun-sen shows the medium-term price direction.
It is calculated in the same way as the Tenkan-sen, but it uses the highest and lowest prices from the last 26 periods. Since it covers more periods, it usually moves more slowly.
Price above the Kijun-sen may show bullish strength, while price below it may show bearish weakness. A flat Kijun-sen may suggest that the market is moving sideways.
Formula:
Kijun-sen = (Highest high over 26 periods + Lowest low over 26 periods) / 2
Calculation example:
Suppose the highest price during the last 26 trading days was Rs. 132 and the lowest price was Rs. 96.
Kijun-sen = (Rs. 132 + Rs. 96) / 2
Kijun-sen = Rs. 228 / 2
Kijun-sen = Rs. 114
Therefore, the Kijun-sen value is Rs. 114.
3. Senkou Span A or Leading Span A
Senkou Span A forms one side of the Ichimoku Cloud.
It finds the middle point between the Tenkan-sen and Kijun-sen. The calculated value is then shown 26 periods ahead on the chart.
Since it uses the faster Tenkan-sen, Senkou Span A reacts more quickly to recent price changes than Senkou Span B.
Formula:
Senkou Span A = (Tenkan-sen + Kijun-sen) / 2
Calculation example:
Using the values calculated above:
Tenkan-sen = Rs. 110
Kijun-sen = Rs. 114
Senkou Span A = (Rs. 110 + Rs. 114) / 2
Senkou Span A = Rs. 224 / 2
Senkou Span A = Rs. 112
Therefore, Senkou Span A is Rs. 112. This value is plotted 26 periods ahead on the chart.
4. Senkou Span B or Leading Span B
Senkou Span B forms the other side of the Ichimoku Cloud.
It finds the middle point between the highest and lowest prices from the last 52 periods. The calculated value is also plotted 26 periods ahead.
Since it uses 52 periods, it reacts more slowly to recent price changes and may show a more stable support or resistance area.
Formula:
Senkou Span B = (Highest high over 52 periods + Lowest low over 52 periods) / 2
Calculation example:
Suppose the highest price during the last 52 trading days was Rs. 140 and the lowest price was Rs. 90.
Senkou Span B = (Rs. 140 + Rs. 90) / 2
Senkou Span B = Rs. 230 / 2
Senkou Span B = Rs. 115
Therefore, Senkou Span B is Rs. 115. This value is also plotted 26 periods ahead.
How Is the Ichimoku Cloud Formed?
Senkou Span A and Senkou Span B together form the shaded area called the Kumo, or cloud.
Using the examples above:
Senkou Span A = Rs. 112
Senkou Span B = Rs. 115
Since Senkou Span A is below Senkou Span B, the future cloud would be considered bearish.
The area between Rs. 112 and Rs. 115 would form the cloud at that point on the chart.
When Senkou Span A is above Senkou Span B, the cloud is considered bullish. When Senkou Span A is below Senkou Span B, the cloud is considered bearish.
A wider gap between the two lines creates a thicker cloud. A smaller gap creates a thinner cloud.
The cloud does not predict the exact future price. It only highlights possible support and resistance areas based on past price data.
5. Chikou Span or Lagging Span
The Chikou Span is the easiest line to calculate.
It simply takes the current closing price and displays the same value 26 periods back on the chart.
Formula:
Chikou Span = Current closing price, plotted 26 periods back
Calculation example:
Suppose today's closing price is Rs. 118.
Chikou Span = Rs. 118
There is no addition or division involved. The value remains Rs. 118, but it is shown 26 periods behind the current candle.
If the Chikou Span is above the older price candles, it may support a bullish reading. If it is below the older candles, it may support a bearish reading. If it is mixed with the older candles, the trend may be unclear.
Complete Calculation Example
| Ichimoku Line | Calculation | Result |
| Tenkan-sen | (Rs. 120 + Rs. 100) / 2 | Rs. 110 |
| Kijun-sen | (Rs. 132 + Rs. 96) / 2 | Rs. 114 |
| Senkou Span A | (Rs. 110 + Rs. 114) / 2 | Rs. 112 |
| Senkou Span B | (Rs. 140 + Rs. 90) / 2 | Rs. 115 |
| Chikou Span | Current closing price | Rs. 118 |
Suggested Read: Straddle vs Strangle on Nifty: How VIX Can Guide the Choice
Limitations of the Ichimoku Cloud
The Ichimoku Cloud can be useful, but it also has some limits:
It Can Look Confusing at First:The chart has several lines and a shaded cloud. Beginners may need time to understand what each part shows.Signals May Appear Late:The indicator uses past price data. Because of this, it may show a signal only after the price has already started moving.The Chart Can Look Crowded:Using all five lines together can make the chart difficult to read, especially when other indicators are also added.Standard Settings May Not Suit Every Market:The usual 9, 26 and 52 settings may not work equally well for every stock, index, timeframe or market condition.One Signal May Not Be Enough:Ichimoku signals may become less reliable in sideways or highly volatile markets. Traders often study them along with volume, price action or other indicators.Settings Should Be Tested Carefully:Any changes to the standard settings should be tested on past charts before they are used for analysis. Adding too many indicators to the same chart should also be avoided, as it can make the setup harder to understand.
Practical Example: Ichimoku Cloud With RSI
Here is a fictional example with numbers to make the setup easier to understand. It is only for education and does not suggest buying or selling any security.
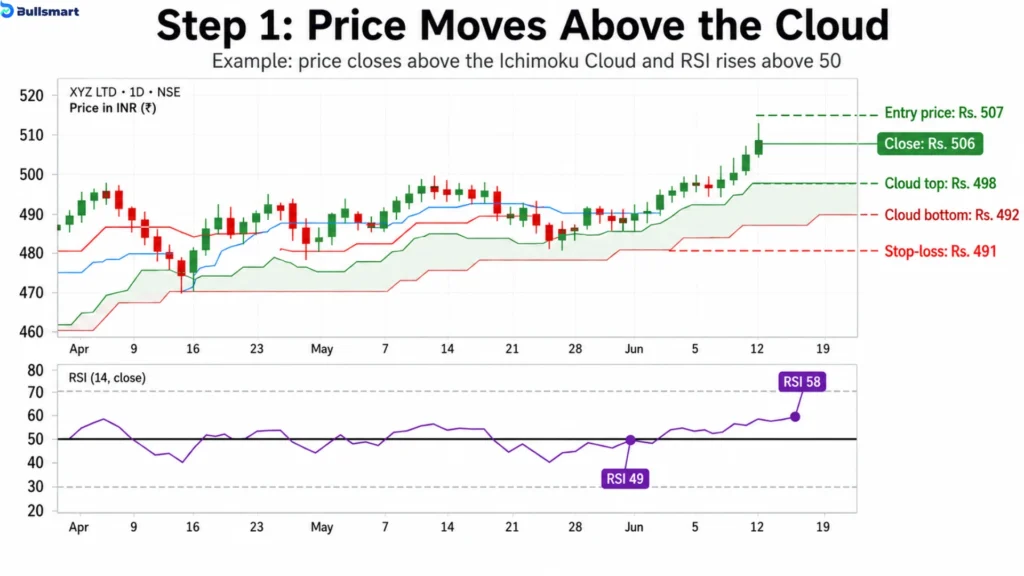
Step 1: Price Moves Above the Cloud
Suppose a stock is trading near Rs. 500.
Top of the Ichimoku Cloud: Rs. 498Bottom of the cloud: Rs. 492Closing price: Rs. 506RSI: rises from 49 to 58
The price has closed above the cloud, while the RSI has moved above 50. Together, these may suggest that upward momentum is becoming stronger.
In this example, the trader records an entry price of Rs. 507 and places a stop-loss below the cloud at Rs. 491.
Step 2: The Price Continues Rising
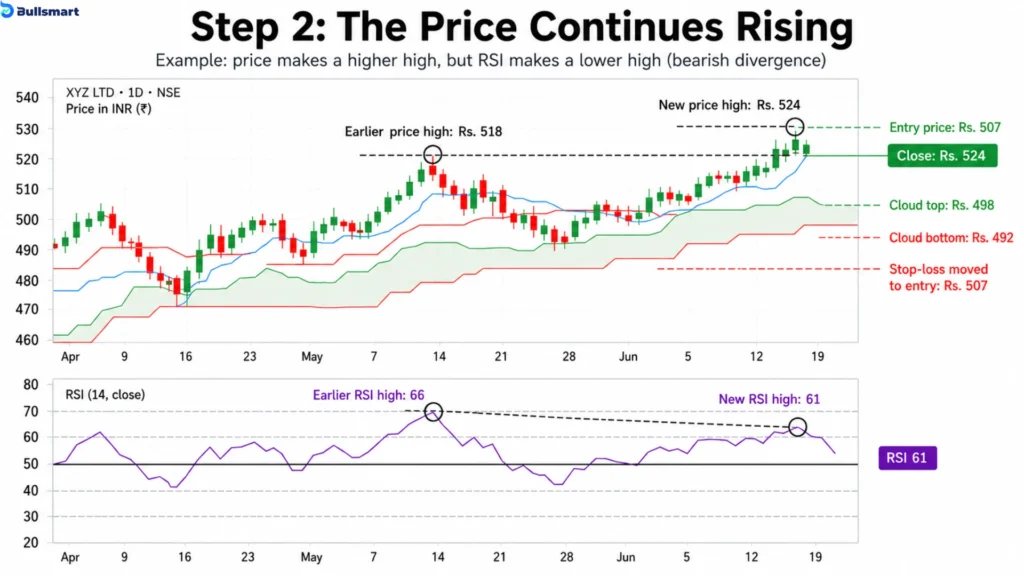
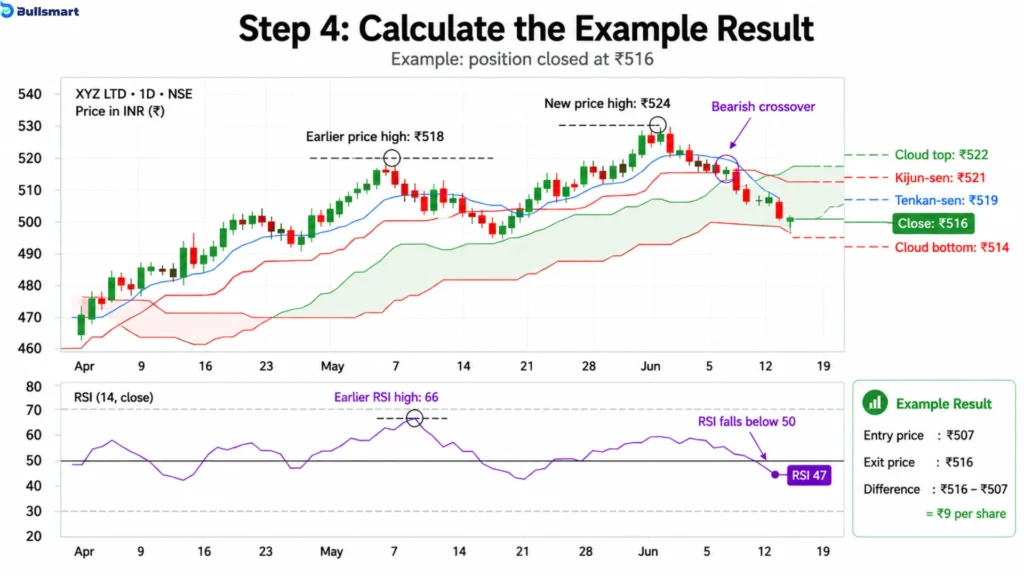
The stock later rises to Rs. 524.
However:
Earlier price high: Rs. 518New price high: Rs. 524Earlier RSI reading: 66New RSI reading: 61
The price has made a higher high, but the RSI has made a lower high. This is called bearish divergence and may indicate weakening momentum.
The trader then moves the stop-loss from Rs. 491 to the entry price of Rs. 507.
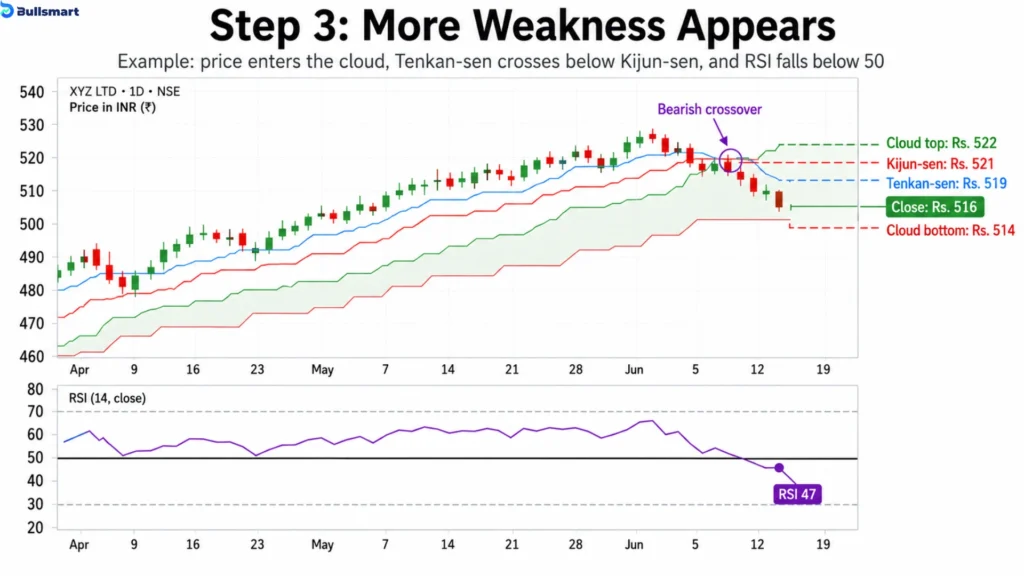
Step 3: More Weakness Appears
Later, the following changes occur:
Tenkan-sen: Rs. 519Kijun-sen: Rs. 521Tenkan-sen crosses below Kijun-senCloud range: Rs. 514 to Rs. 522Closing price: Rs. 516RSI: falls to 47
The price has entered the cloud, the crossover has turned bearish, and the RSI has dropped below 50. These signals together suggest that the earlier bullish momentum may be weakening.
Step 4: Calculate the Example Result
Suppose the position is closed at Rs. 516.
Entry price: Rs. 507
Exit price: Rs. 516
Difference: Rs. 516 - Rs. 507 = Rs. 9 per share
The example gain is Rs. 9 per share before brokerage, taxes, slippage, and other trading costs.
The main lesson is that one signal may start the setup, but several warning signs together may show when market conditions are changing.
The 7 Ichimoku Cloud Signals Every Beginner Should Understand
Do not depend on only one signal. A setup becomes more useful when several Ichimoku signals point in the same direction.
Signal 1: Price Above, Below or Inside the Cloud
This is the easiest way to check the market trend.
Price above the cloud may mean the trend is bullish.Price below the cloud may mean the trend is bearish.Price inside the cloud may mean the market is sideways or unclear.
Think of the cloud as an area, not one exact price. This signal only shows the general trend. It is not a direct buy or sell instruction.
Signal 2: Price Breaking Out of the Cloud
A cloud breakout happens when the price moves fully outside the cloud.
Price moving above the cloud may show growing buying strength.Price moving below the cloud may show growing selling pressure.
Do not treat a small touch or brief move outside the cloud as a confirmed breakout. Many traders wait for the candle to close outside it. Strong trading volume can make the breakout more convincing.
Signal 3: The Tenkan-Kijun Crossover
This signal happens when the Tenkan-sen and Kijun-sen cross each other.
Tenkan-sen crossing above Kijun-sen may be bullish.Tenkan-sen crossing below Kijun-sen may be bearish.
The location of the crossover also matters. A bullish crossover above the cloud may be stronger. A bearish crossover below the cloud may also carry more weight. Crossovers inside the cloud are often less clear.
Signal 4: The Kijun-sen Pullback
The Kijun-sen may act like a moving support or resistance level.
During an uptrend, the price may fall towards the Kijun-sen and then rise again. During a downtrend, the price may move up towards it and then fall again.
This can help traders enter after a small price correction instead of chasing a sudden move. However, a brief move across the Kijun-sen does not always mean the trend has changed.
Signal 5: Chikou Span Confirmation
The Chikou Span shows the current closing price 26 periods back on the chart.
If it is above the older price candles, it may support a bullish signal.If it is below the older candles, it may support a bearish signal.If it is mixed with the older candles, the market direction may be unclear.
The Chikou Span is mainly used to confirm other signals. It should not usually be used alone.
Signal 6: The Future Cloud
The Ichimoku Cloud is shown ahead of the current price.
Senkou Span A above Senkou Span B creates a bullish future cloud.Senkou Span A below Senkou Span B creates a bearish future cloud.
A bullish future cloud may support an uptrend. A bearish future cloud may support a downtrend.
If the current trend and future cloud show opposite directions, the trend may be losing strength. The future cloud only shows possible support and resistance areas. It does not predict the exact future price.
Signal 7: Kumo Twist and Cloud Thickness
A Kumo twist happens when Senkou Span A and Senkou Span B cross each other. This changes the future cloud from bullish to bearish or from bearish to bullish.
The twist may show that the current trend is becoming weaker or may change.
Cloud thickness also matters:
A thick cloud may create a stronger support or resistance area.A thin cloud may be easier for the price to cross.
A Kumo twist or cloud thickness should not be used alone. Always check the other Ichimoku signals before making a trading decision.
How the Ichimoku Signals Can Be Read Step by Step
The Ichimoku Cloud can be studied in a fixed order to understand whether a chart appears more bullish, bearish, or unclear. The steps below are for educational purposes only and should not be treated as trading instructions.
Step 1: Check the Price Position
First, see where the price is placed:
Above the cloud may suggest a bullish trend.Below the cloud may suggest a bearish trend.Inside the cloud may suggest an unclear or sideways market.
Step 2: Look at the Future Cloud
Check which leading span is on top:
Senkou Span A above Senkou Span B may indicate a bullish future cloud.Senkou Span A below Senkou Span B may indicate a bearish future cloud.
Step 3: Compare Tenkan-sen and Kijun-sen
Tenkan-sen above Kijun-sen may support a bullish reading.Tenkan-sen below Kijun-sen may support a bearish reading.
Step 4: Observe Any Pullback
See whether the price temporarily moves towards the Kijun-sen or the cloud before changing direction again.
Step 5: Check the Chikou Span
Chikou Span above earlier candles may support a bullish view.Chikou Span below earlier candles may support a bearish view.
Step 6: Review Trading Volume
Higher volume during a price move may provide additional confirmation, while weak volume may make the signal less clear.
Step 7: Compare All the Signals
A chart may look more bullish or bearish when several signals point in the same direction. However, matching signals do not guarantee that the price will move as expected.
Note of Caution: The Ichimoku Cloud is based on past price data and cannot predict market movements with certainty. Even when several signals match, the price may move in the opposite direction. It should be used only for learning and analysis, along with proper risk assessment and independent research.
How to Use the Ichimoku Cloud in Indian Markets
The Ichimoku Cloud can be studied on Indian stocks and indices, but the chart setting and market conditions can affect how clearly the signals appear.
1. Start with Daily Charts
Daily charts are usually easier to understand than one-minute or five-minute charts. Shorter charts can show frequent price changes, which may create more confusing or false-looking signals.
2. Study Liquid Stocks and Indices
Ichimoku signals are generally easier to read on actively traded instruments, such as:
NIFTY 50NIFTY BankFrequently traded large-cap NSE stocks
Illiquid stocks may show sudden or irregular price movements, making technical signals less clear.
3. Use the Standard Settings First
The commonly used Ichimoku settings are 9, 26 and 52 periods. These settings can be used as a starting point for studying the indicator. Any changes should be tested across different stocks, timeframes and market conditions.
4. Check the Completed Candle
A signal may change while the candle is still forming. On a daily chart, the completed candle provides a clearer view than temporary intraday movement. The regular NSE equity and equity derivatives session generally runs from 9:15 AM to 3:30 PM.
5. Be Aware of Price Gaps
Indian stocks may open sharply higher or lower after company results, major announcements, government decisions, global market changes or overnight news. Such events can temporarily make an existing technical setup less reliable.
Note of Caution: These points explain how the indicator may be studied in Indian markets. They should not be treated as a recommendation to trade any stock, index or strategy.
When the Ichimoku Cloud Can Give Misleading Signals
The Ichimoku Cloud is easier to read when the market is moving clearly upward or downward. In a sideways market, the lines may cross again and again, creating signals that quickly fail.
It is also important to remember that the indicator uses past price data. This means it may react only after a price move has already started. A breakout above or below the cloud can also fail, with the price moving back inside shortly afterwards.
Unexpected news, company announcements, policy changes, or global events can make the technical setup less reliable. You may also see a bullish trend on one timeframe and a bearish trend on another.
A bullish Ichimoku setup does not mean the company is financially strong or fairly valued. The indicator also cannot tell you how much money to risk.
Even if a strategy performed well in past testing, it may not produce the same result in the future. When the trend is weak or unclear, sudden back-and-forth price moves can lead to misleading signals.
Mistakes That Can Turn a Good Signal Into a Bad Trade
Even a clear-looking Ichimoku signal can fail when the wider chart is ignored. Here are some common mistakes to avoid while studying the indicator:
Treating every bullish crossover as a buy signalTreating every bearish crossover as a sell signalReading signals while the price is stuck inside the cloudIgnoring the broader market trendActing before the candle has fully closedUsing the indicator on illiquid stocks with sudden or irregular price movementsChanging the standard settings without testing how they performIgnoring trading volume and other supporting signalsEntering a trade without planning an exit or acceptable lossUsing too much leverage, which can increase losses quicklyAssuming that the future cloud will correctly predict the next price movement
The Ichimoku Cloud works best as a chart-analysis tool, not as a standalone decision-maker. Looking at several signals together may provide a clearer picture, but no setup can guarantee how the market will move.
Risk Check: Why No Ichimoku Signal Is Guaranteed
No technical indicator can tell you exactly what the market will do next. Ichimoku signals only show possible price directions, and even a strong-looking setup can fail.
Before taking any trade, factors such as stop-loss level, position size, available capital, and total trading costs should be considered. Extra care is needed in futures and options because leverage can increase both gains and losses.
SEBI found that ~91% of individual equity F&O traders incurred losses between FY25 and FY26. Their combined losses were more than Rs. 1.8 lakh crore.
This is why the Ichimoku Cloud should be treated as a learning and analysis tool, not as a promise of profit. Studying past charts or using a paper-trading platform can help readers understand how the signals behave without putting real money at risk.
Bottom Line
The Ichimoku Cloud may look complicated at first, but it becomes much easier once you understand what each line is showing. You do not need to read every signal separately or react to every crossover. Start with the bigger picture: check where the price sits compared with the cloud, compare the Tenkan-sen and Kijun-sen, and then use the future cloud and Chikou Span for added context.
The real strength of the Ichimoku Cloud Trading Strategy is that it brings trend, momentum, support, resistance, and confirmation into one chart. However, more information does not mean certainty. Breakouts can fail, trends can reverse, and sudden news can quickly change the setup.
That is why Ichimoku should be treated as a chart-reading framework, not a profit-making shortcut. Take time to study past charts, understand how the signals behave in different market conditions, and avoid depending on one indicator alone. When several signals agree, the chart may become clearer, but risk still remains. Read the cloud, check the wider market, and never assume that any setup guarantees the next move or a profitable outcome.
Disclaimer: This blog is for educational purposes only and does not constitute investment or trading advice. The examples are illustrative. Market investments involve risk, and no indicator or strategy guarantees returns. Please conduct your own research and consult a SEBI-registered adviser before making financial decisions.
FAQs
How does Ichimoku Cloud work?
The Ichimoku Cloud uses five lines to show trend direction, momentum, and possible support or resistance areas. Price above the cloud may suggest bullish conditions, while price below it may suggest bearish conditions. Traders also compare line crossovers, the future cloud, and the lagging span to see whether several signals support the same market direction before drawing any conclusion.
How accurate is the Ichimoku Cloud?
The Ichimoku Cloud does not have a fixed accuracy rate. Its results depend on the market, timeframe, settings, and how each signal is read. It usually works better in clearly trending markets and may give false signals when prices move sideways. Even when several signals agree, the expected price move can still fail or reverse without warning at any time.
What is the win rate of Ichimoku Cloud?
There is no universal win rate for the Ichimoku Cloud. Results change across stocks, indices, timeframes, market conditions, entry rules, exits, and trading costs. Any win-rate claim should be supported by proper backtesting with clearly defined rules. Past results also cannot guarantee that the same method will perform equally well in future market conditions or for every trader.
What is the best indicator to use with Ichimoku Cloud?
RSI is commonly used with the Ichimoku Cloud because it helps show whether momentum is becoming stronger or weaker. Volume can also help confirm a breakout above or below the cloud. However, there is no single best indicator for every market. The right combination depends on the asset, timeframe, strategy rules, and market conditions being studied.