

A sudden break below support can look like a clear bearish signal. Traders exit, shorts enter, and stop losses get triggered. But sometimes, the breakdown fails almost immediately and price moves back into the range.
That is where the Wyckoff Spring becomes relevant.
It is one of the most closely watched patterns in the Wyckoff framework because it can reveal a shift in the balance between supply and demand. What appears to be fresh weakness may actually be the final test of selling pressure before price attempts to move higher.
The challenge is that not every false breakdown is a Spring, and not every Spring leads to a rally. Context matters. The structure of the range, the behavior of volume, the speed of the recovery, and what price does next all play a role.
This blog explains the setup from the ground up, how to recognise it, and how to avoid confusing it with a genuine breakdown.
Let’s spring onto it!
What Is Wyckoff Spring?
A Wyckoff Spring is a failed breakdown in which price briefly moves below the support of an established trading range and then quickly returns inside it.
The move may suggest that selling pressure is being absorbed rather than gaining strength.
When Does a Wyckoff Spring Happen?
It usually appears after a stock has already fallen and then starts moving sideways for some time.
During this sideways movement, price keeps moving between:
- Support: the lower area where price often stops falling
- Resistance: the upper area where price often stops rising
After testing support several times, price suddenly drops below it. This can make traders think a fresh fall has started.
But if price quickly climbs back into the same range, the breakdown may be Wyckoff Spring.
In the Wyckoff framework, this often happens during the later part of the sideways range (Phase C), when the market is testing whether much selling pressure is still left.
Not every sideways range forms a spring. Some stocks simply hold the above support and begin moving higher.
A Simple Hypothetical Example
Suppose a stock falls from Rs. 620 to Rs. 500 and then moves sideways between Rs. 500 and Rs. 550 for several weeks.
During this period:
- Rs. 500 acts like support
- Rs. 550 acts like resistance
- Buyers repeatedly appear near Rs. 500
Then the price suddenly falls to Rs. 490. This looks like a breakdown, so some traders may sell while others may enter short positions.
But the price does not stay below support. It moves back above Rs. 500.
A few days later, price falls again but stops near Rs. 502 instead of making a new low. It then starts moving back toward Rs. 550.
In this example:
- Rs. 490 could be a possible Spring
- The move back above Rs. 500 shows the breakdown failed
- The hold is near Rs. 502 acts like a test
- The later recovery adds more context
Even then, a sustained rally is not guaranteed. This example is fictional and meant only to explain the pattern.
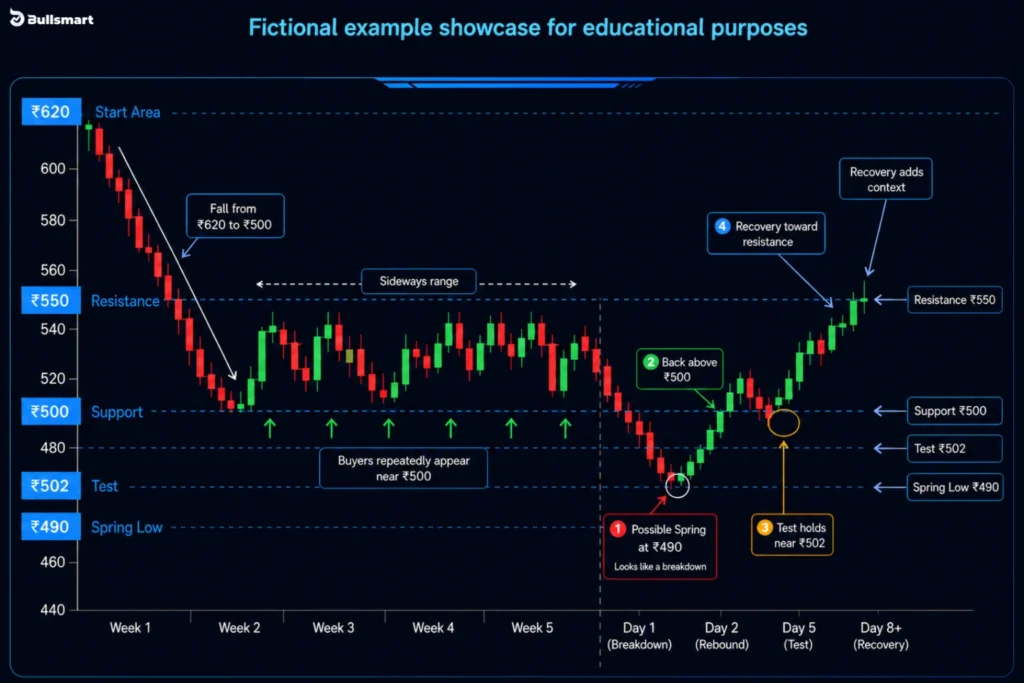
Caution: This example is just a hypothetical simulation of what the wyckoff spring might look like in practical execution. Analyze your risk profile before making any financial decisions.
Suggested Read: Intraday Trading Guide: Best Indicators, VWAP Strategies & Time Frames for NSE Stocks
What Is the Wyckoff Method?
The Wyckoff Method is a way of understanding what may be happening behind a stock’s price movement.
Instead of looking only at whether price is rising or falling, it also studies:
- Price: How the stock is moving
- Volume: How much buying and selling activity is taking place
- Supply: How many shares people are willing to sell
- Demand: How strongly people want to buy
The basic idea is simple: large buyers usually cannot buy everything at once without pushing the price sharply higher. They may buy gradually while the stock moves sideways. Similarly, large sellers may reduce their holdings over time instead of selling everything in one go.
Wyckoff used these observations to understand when buying pressure may become stronger than selling pressure, or the other way around.
It is not a fixed formula or a guaranteed prediction tool. It is a framework for reading price and volume with more context.
Suggested Read: Why Algo Traders Dominate Indian Expiry Day: The Mechanics, the Data, and What Retail Traders Can Do Differently
What Is the Wyckoff Spring Trading Pattern?
Richard Wyckoff was an early 20th-century trader who studied how prices move and why certain patterns repeat. Instead of looking only at short-term gains, he focused on the behaviour behind market moves.
His work suggested that large market participants, such as funds and institutions, often build or reduce positions gradually. Buying a large quantity at once can push prices higher, while selling too quickly can drive prices lower. As a result, this activity may take place while price moves within a range.
This approach later became known as the Wyckoff Method. Its main idea is simple: market prices are shaped by the balance between demand, or buying interest, and supply, or selling pressure.
The Wyckoff Spring is one pattern within this method. It occurs when price briefly falls below support and then returns inside the trading range, creating what may turn out to be a failed breakdown.
Why Does a Spring Trap Retail Traders?
A support level often feels like a floor. When price falls below it, many traders assume the stock will continue falling.
That can lead to three common reactions, likeee:
- Existing holders sell because they fear a bigger loss
- Short sellers enter, expecting further weakness
- Stop-loss orders placed below support get triggered automatically
The problem begins when price quickly moves back above support.
Traders who sell may hesitate to buy again at a higher price. Short sellers may rush to close their positions, which creates additional buying. As a result, the failed breakdown can strengthen the upward move.
This is why a spring can trap traders on the wrong side of the market.
However, a chart cannot prove that large institutions deliberately created the move. It only shows what happened to price and volume. It is safer to focus on the failed breakdown and the recovery rather than assume manipulation.
Suggested Read: Best Stock Buying Strategies and Best Stock Selling Strategies for Great Profits
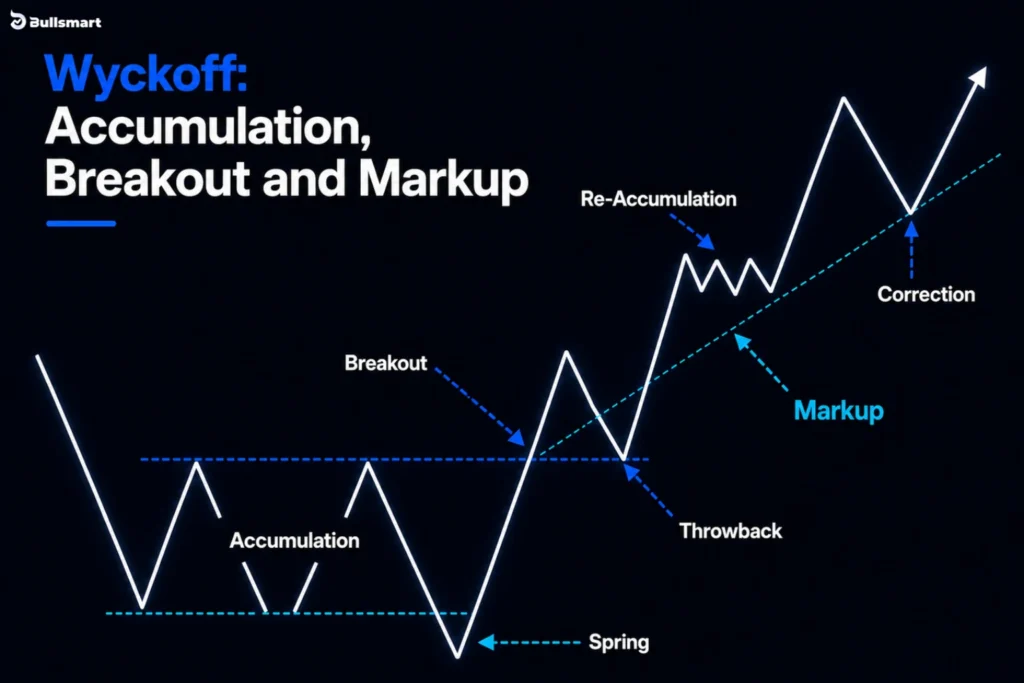
Where Does the Spring Fit in the Wyckoff Accumulation Cycle?
The Wyckoff Accumulation Cycle is a framework used to understand how a stock may shift from a downtrend into a possible uptrend.
After a long fall, prices may not always move up immediately. They may first spend time moving sideways while selling pressure weakens and buying interest gradually builds.
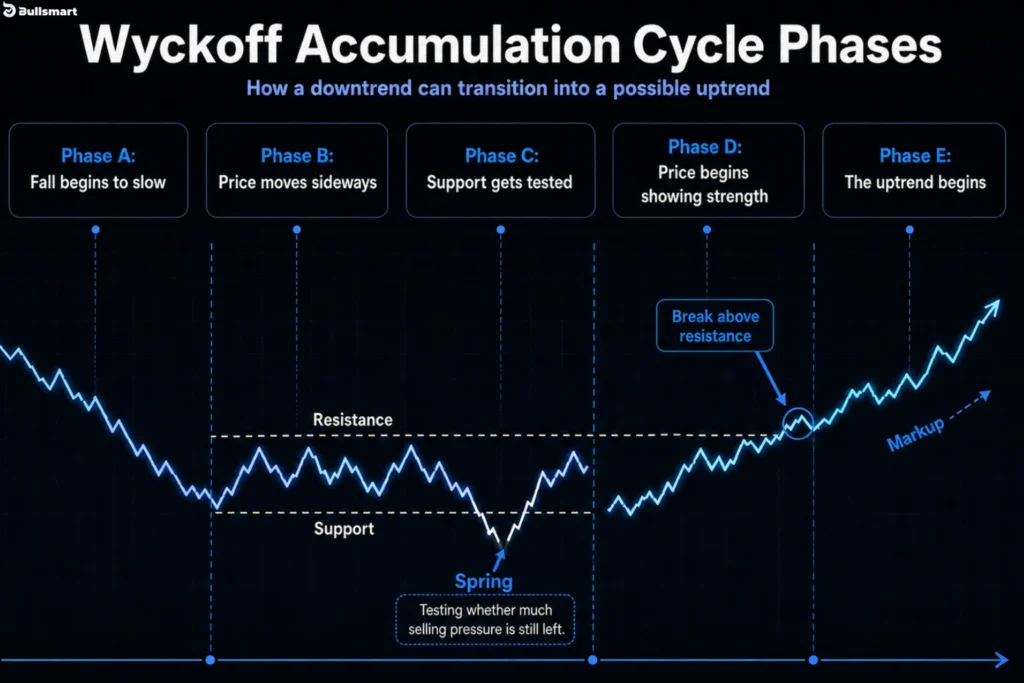
Wyckoff divided this process into five phases:
Phase A: Fall begins to slow
The previous downtrend loses strength. Heavy selling may still appear, but buyers begin absorbing it.
Phase B: Price moves sideways
The stock starts trading between support and resistance. This creates a range where buyers and sellers continue testing each other.
Phase C: Support gets tested
Price may briefly fall below support and then recover. This is where a Wyckoff Spring can appear.
The idea is that the market is testing whether much selling pressure is still left.
Phase D: Price begins showing strength
The stock starts making stronger upward moves and may break above resistance.
Phase E: The uptrend begins
If buying pressure remains strong, price leaves the range and enters the markup stage.
A spring alone does not confirm that accumulation is complete. What price does after the recovery matter just as much.
How to Identify a Wyckoff Spring
These points are best used as cautionary observations, not as a trading signal.
1. Check whether a clear range exists
Price should already be moving between visible support and resistance. A fresh low during an ongoing downtrend may simply be further weakness.
2. Observe the move below support
A possible spring briefly moves below the lower end of the range. The move alone is not enough to confirm anything.
3. See whether price returns inside the range
A quick recovery may suggest that the breakdown failed. If price stays below support and continues making lower lows, the move may be a genuine breakdown.
4. Read volume carefully
Lower volume may suggest limited selling interest, while higher volume may show intense activity around the breakdown. Neither confirms a spring by itself.
5. Watch the behaviour that follows
Higher lows, stronger recovery, or price holding above the Spring low may add context. Even then, the pattern can fail.
The safest approach is to treat a spring as a possible interpretation of price behaviour, not proof that a rally is about to begin.
How to Apply a Wyckoff Spring
- Find a clear support level after a downtrend.
- Wait for the price to briefly fall below that support.
- Check whether the price quickly moves back above the level.
- Look for stronger buying volume during the recovery.
- Confirm the pattern on a higher timeframe.
- Use other signals, such as oversold conditions or a moving average, for added confirmation.
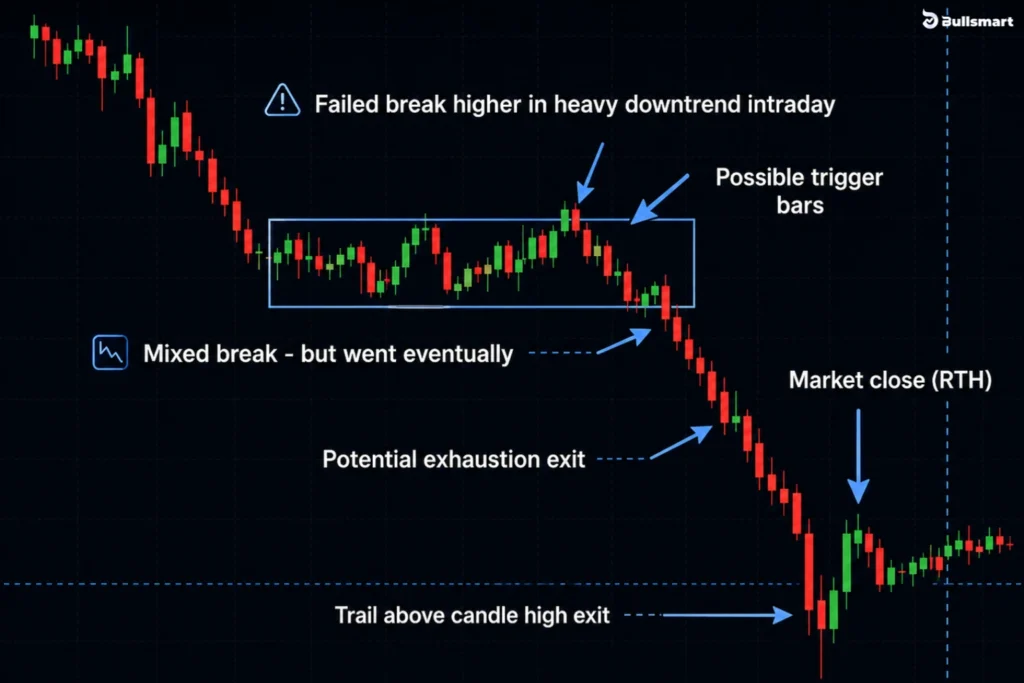
Wyckoff Spring vs Genuine Breakdown
Both can begin the same way: price falls below support.
The difference is what happens next:
| What to observe | Possible Wyckoff Spring | Genuine Breakdown |
| Move below support | Price briefly falls below support | Price falls below support and stays there |
| Recovery | Price quickly returns inside the range | Recovery is weak or fails |
| Next price movement | Price may form a higher low | Price continues making lower highs and lower lows |
| Selling pressure | Selling may reduce after the break | Selling pressure remains strong |
| Overall meaning | The breakdown may have failed | The downward move may still be continuing |
Both can look similar when price first drops below support. The difference often becomes clearer only after observing what price does next.
A move that looks like a spring at first can still turn into a genuine breakdown later, so it should never be treated as a confirmed reversal on its own.
Wyckoff Spring vs Upthrust
A Wyckoff Spring and an Upthrust are opposite price movements. Both briefly break an important level and then return inside the trading range.
| What to observe | Wyckoff Spring | Wyckoff Upthrust |
| Where it appears | Near the lower end of a trading range | Near the upper end of a trading range |
| Initial move | Price briefly falls below support | Price briefly rises above resistance |
| What happens next | Price returns inside the range | Price falls back inside the range |
| Possible meaning | Selling pressure may be weakening | Buying pressure may be weakening |
| Commonly linked with | Accumulation | Distribution |
| Traders who may get trapped | Sellers and short traders | Buyers and breakout traders |
| Possible next move | Price may attempt to move higher | Price may attempt to move lower |
In simple terms, a spring is a failed breakdown, while an Upthrust is a failed breakout. Neither pattern confirms the next move on its own. What price and volume do afterward matters more.
Common Mistakes Traders Make
A Wyckoff Spring can look convincing, but it is easy to misread. These are some common mistakes to avoid:
- Calling every false breakdown a spring: A brief move below support is not enough. A possible spring usually appears within a clear sideways range after a decline.
- Reacting too quickly: Price may keep falling after breaking support. A recovery back into the range provides more context than the breakdown alone.
- Focusing on one candle: One sharp reversal does not confirm the pattern. The wider price structure and trading volume also matter.
- Assuming a rally must follow: Even a well-formed setup can fail because of market weakness, company news, low liquidity, or sudden volatility.
- Ignoring the bigger picture: A Spring should not be studied in isolation. Broader market direction, fundamentals, liquidity, and personal risk limits remain important.
The key is to treat the pattern as one possible reading of market behaviour, not as a guaranteed signal.
Can a Wyckoff Spring Be Used Alone?
No. A Wyckoff Spring should not be used alone to make a trading decision.
It is only one clue on the chart. Traders may also look at:
- Support and resistance
- Price and volume
- The overall market trend
- Company news and fundamentals
- Liquidity and volatility
- Their own risk limits
Even if the setup looks strong, it might still fail. Price may fall below support again, the market may turn weak, or sudden news may change the move.
The main point is simple: a Wyckoff Spring can help explain what may be happening, but it does not guarantee a rally. It should be used with other information and proper risk control.
Bottom Line
A Wyckoff Spring can be useful because it teaches traders not to react to the first move they see. A break below support may look bearish, but the real clue often comes from what happens next. Does price stay below the range, or does it quickly recover? Does selling continue, or does pressure begin to fade?
That said, a Spring is not a promise of a rally. It is simply one way to read the balance between buyers and sellers. The wider range, volume behaviour, market trend, company news, liquidity, and risk conditions still matter. Even a convincing setup can fail.
The most practical lesson is to avoid treating every breakdown as final and every recovery as bullish. Instead, slow down and study the follow-through. A possible spring becomes more meaningful only when price returns to the range and later shows strength.
In trading, the goal is not to predict every bottom. It is to understand the setup clearly, avoid emotional decisions, and manage risk when the market proves your first reading wrong.
Disclaimer: Investments in securities markets are subject to market risks. Please read all scheme-related documents carefully before investing. Past performance is not indicative of future results.
This blog is intended solely for educational and informational purposes. It should not be considered investment advice or a recommendation to buy, sell, or hold any security. Market patterns, including the Wyckoff Spring, may not always produce the expected outcome. Readers should conduct their own research and consult a SEBI-registered investment adviser before making any investment decision.
FAQs
What is the Spring in the Wyckoff Method?
A Wyckoff Spring is a brief move below support that quickly fails. Price drops under the lower end of a trading range, making the breakdown look real, but then moves back inside the range. It may show that selling pressure is weakening, but it does not guarantee that price will rise.
What Are the 4 Phases of Wyckoff?
The Wyckoff market cycle has four main stages: accumulation, markup, distribution, and markdown. Accumulation is when price moves sideways after a fall. Markup is the upward trend. Distribution happens when selling builds near higher levels. Markdown is the downward trend that follows when selling pressure becomes stronger than buying.
What Is the Wyckoff Spring in Phase C?
Phase C is the part of the accumulation cycle where support may be tested. Price can briefly fall below the trading range and then return inside it. This failed breakdown is called a Spring. It may suggest that less selling pressure remains, but traders still need to observe what price does afterward.
What Is the Opposite of a Wyckoff Spring?
The opposite of a Wyckoff Spring is commonly called an Upthrust. A Spring briefly falls below support and recovers, while an Upthrust briefly rises above resistance and then drops back inside the range. It may appear during distribution and can suggest that buying pressure is weakening rather than becoming stronger.