Ever wondered why some investors swear by balance sheets while others obsess over candlestick charts?
In the world of stock market investing, there are two powerful approaches to analyzing stocks: Fundamental Analysis and Technical Analysis. While one dives deep into a company’s financials and long-term potential, the other focuses on price movements, patterns, and market psychology.
In 2026, as AI tools, algorithmic trading, and real-time data reshape investing, understanding the difference between fundamental and technical analysis is more important than ever, especially for Indian investors navigating a fast-evolving market.
Whether you’re looking to hold quality stocks for years or time your entries and exits like a pro, this guide breaks down both methods, their tools, and when to use them. Plus, we’ll show you how modern investors are blending both to build smarter portfolios.
Ready to decode the markets? Let’s dive into the powerful 2026 guide to fundamental vs technical analysis of stocks.
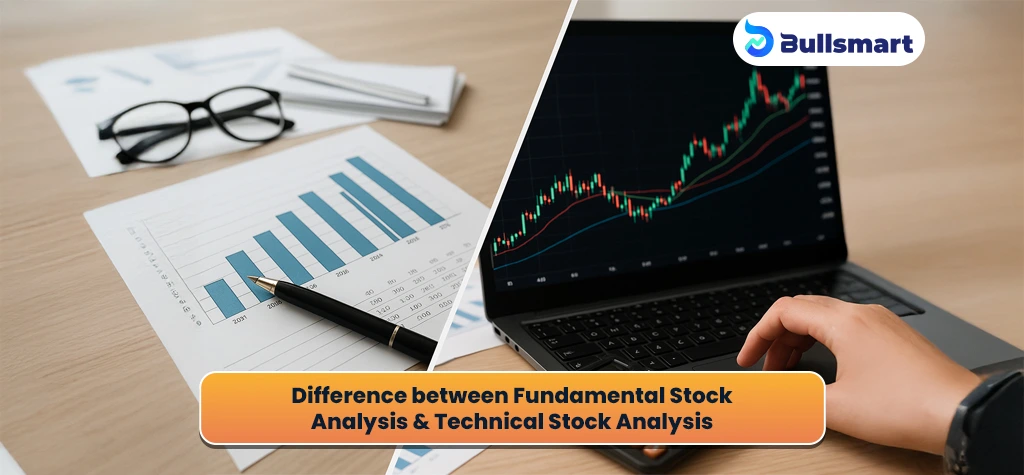
What is Fundamental Analysis of Stocks?
Fundamental analysis is the process of evaluating a company’s intrinsic value by examining its financial health, industry position, and macroeconomic environment. It answers a simple question: “Is this stock worth the price it’s trading at?”
Instead of focusing on stock charts or price movements, this method digs into what’s happening inside the business.
Key Components of Fundamental Analysis
| Indicator | What It Shows | Why It Matters |
| Earnings Per Share (EPS) | Profit earned per share | Measures profitability |
| Price-to-Earnings Ratio (P/E) | Valuation of stock vs earnings | Tells if stock is over/undervalued |
| Return on Equity (ROE) | Profitability relative to shareholder equity | Efficiency in using capital |
| Debt-to-Equity Ratio | Company’s financial leverage | Gauges financial risk |
| Revenue Growth | Increase in sales over time | Sign of business expansion |
| Net Profit Margin | % of revenue that becomes profit | Operational efficiency |
What It Tells You
- Is the company profitable and stable?
- Is it growing consistently?
- Does it have a strong balance sheet?
- How does it compare with its competitors and industry?
When Should You Use Fundamental Analysis?
- For long-term investing
- When comparing companies across sectors
- To find undervalued stocks or blue-chip picks
Example Approach
Suppose you’re evaluating ABC Corp. You’d review its financial statements for consistent revenue growth, manageable debt, and robust profit margins. Then, compare these metrics with competitors and factor in economic forecasts relevant to ABC’s industry. If ABC trades below its estimated intrinsic value, it may be considered a good long-term investment candidate.
Fundamental analysis goes beyond numbers; it’s about building a comprehensive picture of both a company’s strengths and the challenges it faces in the current market climate.
What is Technical Analysis of Stocks?
While fundamental analysis asks, “What is this company worth?”, technical analysis asks, “What is the stock price telling us?”
Technical analysis is the study of price movements, trading volume, and market trends using historical data. It doesn’t focus on company financials, but instead analyzes patterns in stock charts to predict future movements.
In 2026, with fast-paced markets and algorithmic trading, technical analysis tools are more relevant than ever, especially for active traders in the Indian stock market.
Key Tools Used in Technical Analysis
| Tool / Indicator | Purpose | Interpretation Example |
| Candlestick Charts | Visualize price movements | Bullish/bearish reversals, Doji, Hammers |
| Moving Averages (MA) | Identify trend direction | 50-day/200-day MA crossovers |
| Relative Strength Index (RSI) | Measure overbought/oversold levels | RSI > 70 = overbought; < 30 = oversold |
| MACD | Signal trend reversals | Bullish crossover = buy signal |
| Volume | Confirm price strength | Price rise + high volume = strong trend |
Suggested Read: Time vs. Timing: Maximizing Growth Potential
Market Psychology and Timing
Technical analysis assumes that all available information is already reflected in a stock’s price and that patterns tend to repeat due to collective market behavior.
By studying these price movements, traders aim to predict short-term directions and perfect their timing for buying or selling.
When Should You Use Technical Analysis?
- For short-term trading or swing trades
- To find entry and exit points
- In volatile market environments like earnings seasons or geopolitical events
Example Approach
Suppose you’re interested in trading shares of XYZ Ltd. You’d use charting tools to spot uptrends, identify support/resistance, and analyze indicators like RSI for overbought or oversold conditions.
If the indicators align, you might enter a trade aiming to profit from the predicted price move, planning your exit according to set stop-loss and take-profit points.
Technical analysis provides a systematic approach for interpreting market behavior, emphasizing timing and momentum over deep company research.
Fundamental Analysis vs Technical Analysis: Key Differences
While both methods aim to help you make smarter stock decisions, fundamental analysis and technical analysis take completely different routes. One looks at a company’s value, while the other looks at the stock’s price behavior.
Think of it this way:
- Fundamental analysis is like reading a company’s biography.
- Technical analysis is like watching its heartbeat on a monitor.
Side-by-Side Comparison
| Feature | Fundamental Analysis | Technical Analysis |
| Objective | Find a stock’s intrinsic value | Predict future price movements |
| Time Horizon | Long-term investing | Short- to medium-term trading |
| Data Used | Financial statements, macroeconomic indicators | Price charts, trading volume, patterns |
| Tools | P/E ratio, ROE, balance sheet | RSI, MACD, candlestick charts, moving averages |
| Focus | Business health, earnings potential | Market sentiment, trends, support/resistance levels |
| Ideal For | Investors looking for value and growth | Traders timing entries and exits |
| Viewpoint | “What is the company worth?” | “What is the stock likely to do next?” |
Mindset Difference: Investor vs Trader
- Fundamental Analysis = “I buy the business”
- Technical Analysis = “I trade the stock”
Fundamental vs Technical: Practical Examples
- Fundamental analysis might lead an investor to buy shares of a company with strong earnings growth and a robust balance sheet, intending to hold for several years.
- Technical analysis could prompt a trader to act on a bullish candlestick pattern, buying a stock in anticipation of a short-term price rally and selling once a resistance level is hit.
Why Distinction Matters
Choosing the right method depends on your investment goals, risk tolerance, and preferred timeframe. Some investors may find value in combining elements of both analyses for a more holistic approach to the market.
Pros and Cons of Each Approach
Understanding the advantages and disadvantages of both fundamental and technical analysis is crucial for selecting the method or combination that best fits your investment style.
Fundamental Analysis
Pros
- Provides a comprehensive understanding of a company’s true value.
- Ideal for identifying undervalued stocks with long-term growth potential.
- Enables informed investment decisions based on tangible data and financial health.
Cons
- It can be time-consuming, requiring deep analysis of financial statements and industry trends.
- Less effective for short-term trading as price movements may deviate from fundamentals in the near term.
- External events (such as politics or unforeseen crises) can temporarily distort valuations.
Technical Analysis
Pros
- Helps identify optimal entry and exit points based on market trends and momentum.
- Suitable for short-term traders aiming for quick profits.
- Offers systematic rules through indicators and patterns, simplifying decision-making.
Cons
- Ignores company fundamentals, which may lead to missteps if market sentiment rapidly changes.
- Subject to personal interpretation, two traders may see different patterns in the same chart.
- Can result in overtrading if not applied with discipline.
Can You Use Them Together?
Many modern investors blend both fundamental and technical analysis to maximize their success. Here’s how combining the two approaches can offer a strategic edge:
- Use fundamental analysis to select quality stocks with strong financials for your watchlist.
- Apply technical analysis to fine-tune entry and exit points, capitalizing on short-term trends without ignoring long-term potential.
- Example: An investor might choose a fundamentally strong tech stock, then use technical indicators like moving averages or RSI to decide when to buy or sell.
Integrating these methods allows you to harness the strengths of both, combining deep insights with precise timing for more confident decision-making.
Which Analysis Should You Choose in 2026?
In today’s fast-paced markets, there’s no one-size-fits-all answer. Whether you use fundamental analysis or technical analysis depends on your goals, risk tolerance, and investment style.
Key Factors to Evaluate
Investment Goals
- Long-term investors might favor fundamental analysis to anchor company value and steady growth.
- Short-term traders usually lean towards technical analysis for timing the market and capitalizing on quick movements.
Risk Tolerance
- If you’re risk-averse, focusing on solid fundamentals can offer peace of mind.
- If you’re open to higher risk for the possibility of fast gains, technical analysis might be a better fit.
Time Commitment and Skill Level
- Fundamental analysis involves in-depth research but may require less active trade management.
- Technical analysis demands regular market monitoring and swift decision-making.
2026 Market Trends
- Technological advancements have made real-time data and AI-powered analysis tools widely accessible, favoring hybrid approaches.
- Rapid news flow and increased retail participation mean technical analysis signals can move markets more quickly, but core fundamentals anchor stocks through volatility.
Ask Yourself These Questions
| Question | If Yes → Use… |
| Are you investing for long-term wealth? | Fundamental Analysis |
| Do you want to trade short-term price moves? | Technical Analysis |
| Are you researching a company’s business model? | Fundamental |
| Are you timing entries & exits? | Technical |
| Do you want to combine both strategies? | Hybrid Approach |
Advice for Different Investors
- Beginners: Start by learning fundamental analysis to grasp how companies and markets operate. This foundation makes it easier to assess long-term investment value.
- Experienced Investors: Experiment with layering in technical analysis for improved timing of buys and sells, especially in volatile or trend-driven markets.
- Hybrid Strategy Advocates: Select fundamentally sound stocks but wait for technical indicators to align before entering or exiting a position.
The Evolving Nature of Stock Analysis
No single approach dominates in 2026. The most successful investors are flexible, adapting methods to shifts in market conditions, technology, and their own learning curve. Combining both analyses often yields a balanced, informed perspective that can enhance your performance across cycles.
Explore, experiment, and refine, let your unique objectives guide which analysis takes the lead in your investment decisions.
Suggested Read: How to Analyze a Stock Using AI in 2026? Powerful AI Stock Analysis Tools & Smart Strategies
Real-World Use Case: One Stock, Two Perspectives: Tata Consultancy Services (TCS)
To make stock analysis easy to grasp, let’s use Tata Consultancy Services (TCS), one of India’s most respected IT companies, as our example. We’ll look at TCS from both a fundamental and a technical analysis viewpoint, explaining each in simple terms and showing you where this information comes from.
Fundamental Analysis (Looking at the Company’s Health)
Think of fundamental analysis like a doctor’s check-up for a company. The goal is to judge if TCS is healthy, growing, and worth your long-term investment.
What’s the Business?
TCS develops software and provides IT solutions to companies around the world. It is known for stability and reliability.
Financial Health in Simple Terms
- Current share price: Around ₹3,207 as of July 18, 2025.
- Profit last year: Nearly ₹49,511 crore.
- Growing, but not super-fast, sales have increased by about 10% per year over the past 5-10 years.
- Return on equity (ROE): Over 50%, meaning the company is efficient at using its money to generate profits.
- Dividend payouts: High( about 1.85 %), so investors regularly receive part of the profits.
- Price-to-earnings (P/E) ratio: About 23.5; this measures how expensive the stock is compared to its profits. For TCS, this is in line with other strong tech stocks.
Is TCS Worth Investing In?
Big investors often like TCS for being steady and returning money to shareholders. If you want a solid, long-term investment and aren’t looking for wild price swings, TCS can be a good pick.
Technical Analysis (Looking at Price Trends and Patterns)
Technical analysis is like trying to spot traffic patterns: you check how the stock price moves to predict where it might go next often for short-term goals.
What Do the Charts Say?
Recent TCS price: About ₹3,207. Its price has been moving within a range recently, with ups and downs, a sign of indecision in the market
Common Technical Signals in July 2025
- The stock has dropped about 7% in the last month and over 22% in the last 6 months.
- Key levels: Support (where price finds it hard to go lower) near ₹3,050-₹3,200, and resistance (where price struggles to go higher) above ₹3,800.
- Technical indicators like Moving Averages and RSI might currently suggest “wait and watch”, meaning there’s no strong up or down signal yet.
For a Trader, What Does This Mean?
If you’re buying for a quick gain, technical analysis says to wait for a clear breakout (sharp move above resistance) or for the price to bounce off support with volume.
Quick Comparison Table
| Perspective | Main Focus | Key Takeaway for TCS |
| Fundamental | Company health & profit potential | Steady, profit-making, good for long term |
| Technical | Price patterns & trading trends | Moving sideways, no strong trade signal |
Simplified Summary
- If you plan to hold TCS for years, focus on the company’s fundamentals (profits, growth, stability).
- If you want to trade for quick wins, watch charts and technical indicators for changes in price momentum.
Suggested Read: Best AI Investment Tools for Smarter Portfolio Management in 2026
Common Mistakes to Avoid in Stock Analysis
Whether you’re a long-term investor or a short-term trader, it’s easy to fall into traps, especially when you’re starting out. While both fundamental analysis and technical analysis offer valuable insights, using them incorrectly can lead to poor decisions and missed opportunities.
Here are some of the most common mistakes investors make and how you can avoid them.
Using Only One Method in Isolation
Relying solely on either fundamentals or technicals can give you an incomplete picture.
A company might be financially strong but technically overbought or technically attractive but fundamentally weak.
Smart move: Use fundamentals to assess the business and technicals to time your trades.
Blindly Following Stock Tips
In today’s social media-driven environment, it’s tempting to follow influencers, forums, or YouTube “experts” without doing your own analysis.
Smart move: Validate every stock idea with your own research, check key ratios, study the charts, and understand the company.
Ignoring the Broader Market Context
A good stock can still perform poorly if the overall market is in a downtrend or facing macroeconomic pressure. Beginners often overlook this context.
Smart move: Always factor in market sentiment, interest rates, inflation trends, and global cues before making a decision.
Overcomplicating Your Analysis
New investors often try to use every indicator and ratio they come across. This leads to confusion and conflicting signals.
Smart move: Focus on 2-3 core indicators that you understand well. Simplicity often leads to better clarity and confidence.
Not Reviewing or Updating Your Research
Markets evolve. A company that was a strong buy last year may no longer be attractive due to changing fundamentals or technical breakdowns.
Smart move: Regularly update your analysis. Track quarterly results, earnings calls, and major price shifts to stay informed.
By avoiding these common mistakes and taking a balanced approach, you’ll be in a much better position to make confident and well-informed investing decisions, especially in a fast-paced market like 2026.
Final Verdict: What Smart Investors Are Doing in 2026
In 2026, smart investors aren’t choosing between fundamental and technical analysis, they’re combining both to gain an edge.
Fundamental analysis helps them identify strong businesses with healthy financials, long-term growth, and reliable management. Whether it’s Titan, HDFC Bank, or any other stock, they begin with one question: Is the business worth investing in?
But fundamentals alone don’t tell you when to enter. That’s where technical analysis comes in by studying price trends, moving averages, and RSI levels, they know whether the timing is right.
In today’s data-driven world, the most effective approach is no longer either/or, it’s a hybrid strategy. With AI tools and charting platforms now at everyone’s fingertips, retail investors are making smarter, faster, and more confident decisions than ever before.
Know what to buy. Know when to buy. That’s the real game changer.
Disclaimer: Investments in securities market are subject to market risks. Read all the related documents carefully before investing. The securities are quoted as an example and not as a recommendation.
FAQs
Which is better: technical analysis or fundamental analysis?
Technical analysis can be useful for determining when to make an investment quickly, while fundamental analysis can be beneficial for determining whether an investment is worthwhile in the long term.
Can you use both fundamental and technical analysis?
Although there is no definitive answer whether technical analysis can be used as a whole substitution for fundamental analysis, there is little doubt that combining the strengths of both strategies can help investors better understand the markets and gauge the direction in which their investments might be headed.
Which chart is best for stock analysis?
Examining price charts is a great way to learn about stock price behavior. Fundamental analysts use them to pinpoint inflection points tied to past events, while technical traders rely on price charts to identify entry and exit points. Reading a price chart is the first skill a technical trader should learn.
What are the best technical indicators for beginners?
Three beginner-friendly indicators are: RSI (for momentum), Moving Averages (for trend direction) and MACD (for reversals).