Understanding market psychology is the foundation of successful trading. One of the most time-tested ways traders decode market sentiment is through candlestick patterns.
Originating from Japanese rice traders centuries ago, candlestick charts are now the global standard in financial markets, from stocks and forex to crypto and commodities.
In this detailed guide, you’ll learn:
- What candlestick patterns are
- How to read a candlestick
- The top 5 candlestick patterns used globally
- Where to use them
- What does each pattern mean
- Tips to improve your accuracy when using them
Whether you’re a new trader or looking to sharpen your chart-reading skills, this guide will help you level up.
What is a Candlestick Pattern?
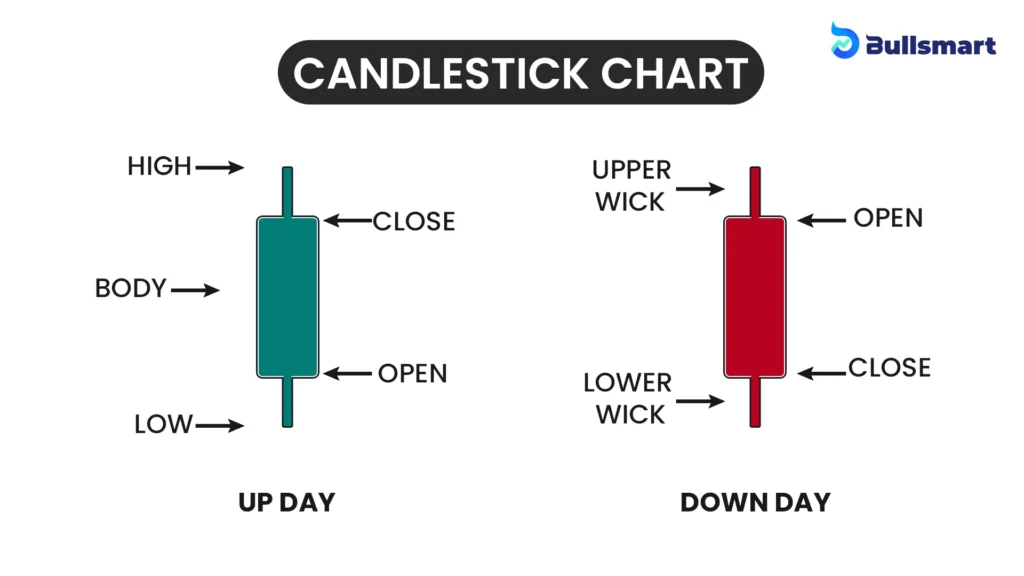
A candlestick pattern is a visual representation of price movements in a particular time frame. These patterns give clues about trader psychology and help predict future market behavior. Each candlestick shows four main price levels:
- Open: Price at the beginning of the time period
- High: Highest price during the time period
- Low: Lowest price during the time period
- Close: Price at the end of the time period
Suggested Read: Heatmaps in Stock Market: 5 Powerful Insights to Master Your Trades Today
How to Read a Single Candlestick
Let’s break it down:
| Element | Description |
| Body | The area between the open and close prices |
| Wick/Shadow | The lines above and below the body (highs and lows) |
| Color | Usually green (price went up) or red (price went down) |
Example
- A green candle means the close was higher than the open (bullish).
- A red candle means the close was lower than the open (bearish).
Long wicks show price rejection or indecision. Short wicks often indicate strong momentum.
Top 5 Most Commonly Used Candlestick Patterns (Globally)
Let’s dive into the world’s most trusted patterns.
1. Doji: Indecision in the Market
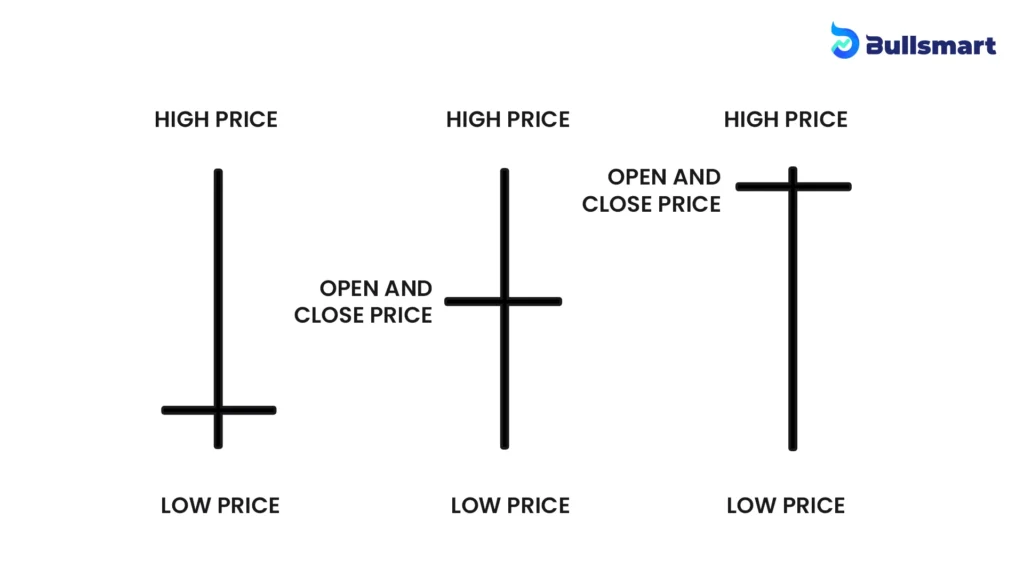
- Formation: Open and Close prices are nearly the same.
- Wicks: Can be long or short.
- Interpretation: Neither buyers nor sellers are in control.
- Best Used: At the end of a trend signals potential reversal.
- Variants
- Gravestone Doji: Bearish signal after an uptrend
- Dragonfly Doji: Bullish signal after a downtrend
- Gravestone Doji: Bearish signal after an uptrend
Pro Tip: Confirm with volume and trendline support/resistance.
2. Hammer & Inverted Hammer: Bullish Reversal Patterns
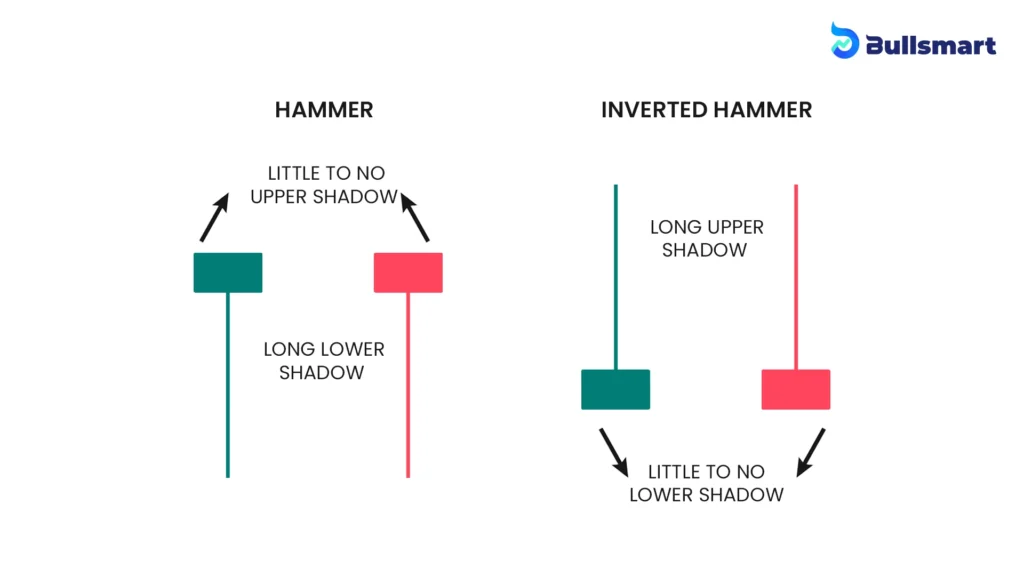
- Hammer
- Appears after a downtrend
- Has a small body and a long lower wick
- Shows buyers pushed prices up after sellers tried to dominate
- Appears after a downtrend
- Inverted Hammer
- Also appears after a downtrend
- Looks like a hammer flipped upside down
- Indicates potential reversal if followed by a green candle
- Also appears after a downtrend
Best Time to Use: Near key support levels
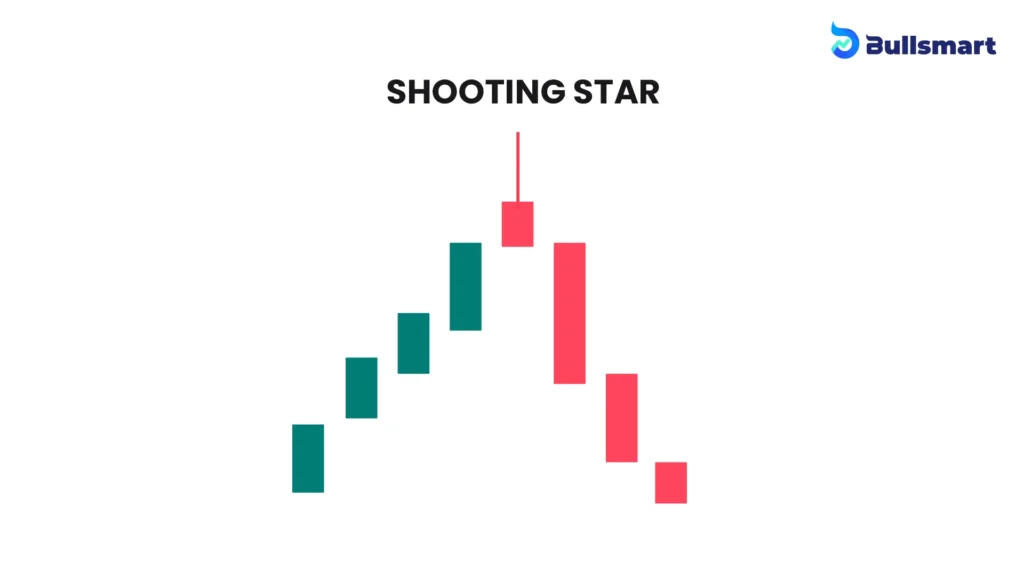
3. Shooting Star: Bearish Reversal Signal
- Formation: Small body at the bottom with a long upper shadow.
- Appears: At the top of an uptrend.
- Meaning: Buyers tried to push the price up but failed, and sellers took over.
- Opposite: Inverted Hammer, which is bullish.
Confirm with RSI or bearish volume spike for better accuracy
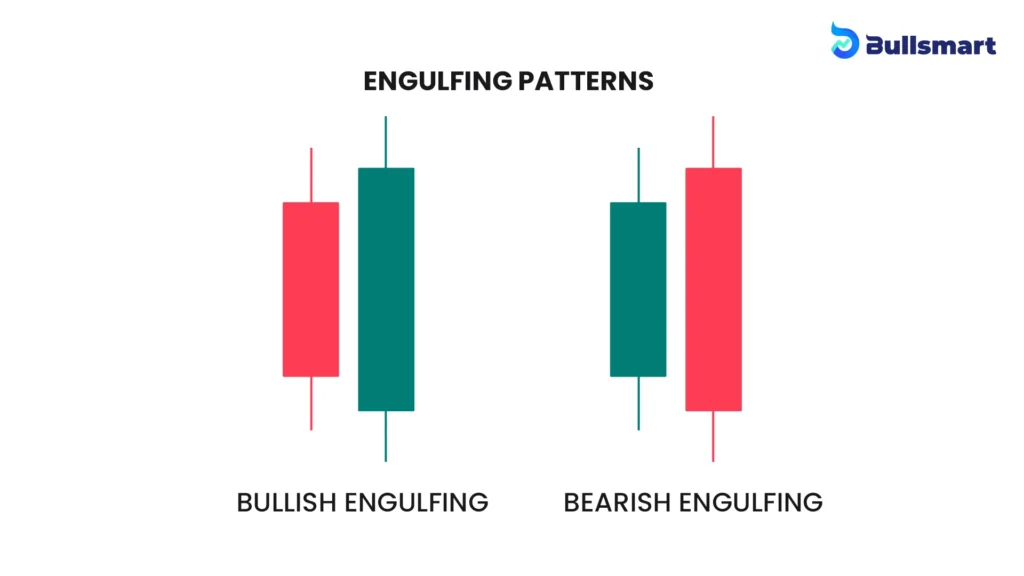
4. Bullish and Bearish Engulfing Patterns: Strong Reversals
- Bullish Engulfing
- Green candle fully engulfs the red candle before it
- Signals strong buyer momentum after a downtrend
- Green candle fully engulfs the red candle before it
- Bearish Engulfing
- Red candle engulfs the green candle before it
- Signals powerful selling pressure after an uptrend
- Red candle engulfs the green candle before it
Best Time to Use: On daily or 4H charts near support/resistance
5. Morning Star / Evening Star: Reliable Trend Reversal Patterns
- Morning Star (Bullish)
- 3-candle formation: Red candle → Small candle → Big green candle
- Appears after a downtrend
- Signals market reversal and optimism
- 3-candle formation: Red candle → Small candle → Big green candle
- Evening Star (Bearish)
- 3-candle formation: Green candle → Small candle → Big red candle
- Appears after an uptrend
- Signals market reversal and pessimism
- 3-candle formation: Green candle → Small candle → Big red candle
Highly Reliable when volume confirms and the middle candle is a Doji or spinning top.
When and Where to Use These Patterns
| Pattern | Market Phase | Use Case Scenario |
| Doji | End of trend | Reversal signal if confirmed with volume |
| Hammer | Downtrend | Bullish reversal at support |
| Shooting Star | Uptrend | Bearish reversal at resistance |
| Engulfing | Trend end/zones | Strong trend reversal signal |
| Morning/Evening Star | Uptrend/Downtrend | Clear directional shift in sentiment |
Real-World Use Case: How Traders Apply This
Let’s say a stock is in a downtrend. You spot a hammer candle on the daily chart near a previous support zone, and RSI is below 30 (oversold). The next day, a big green candle forms.
This is your confirmation. A smart trader may enter a buy position, set a stop loss below the wick, and target the next resistance zone.
Pro Tips for Using Candlestick Patterns Effectively
- Don’t trade candlesticks alone. Use:
- Support/Resistance
- Trendlines
- RSI, MACD, Moving Averages
- Support/Resistance
- Higher timeframes offer more reliable signals (4H, 1D).
- Avoid trading during news events—patterns can fail due to high volatility.
- Backtest patterns using historical data and journaling.
- Use a risk-reward ratio of at least 1:2 when trading these patterns.
Conclusion
In the fast-moving world of trading, candlestick patterns remain one of the most powerful tools to understand what the market is really thinking. Think of them as little clues—each candle telling a story about buyers, sellers, hesitation, or momentum. The more fluently you speak this language, the sharper your edge becomes.
By mastering the top candlestick patterns like the Doji, Hammer, and Engulfing formations, you’re not just memorizing shapes—you’re decoding emotion, behavior, and potential reversals.
Pair them with solid technical tools like RSI or support/resistance zones, and you’ve got a winning strategy in hand.
So whether you’re just starting out or looking to refine your skills, keep observing, keep testing, and most importantly—keep learning. Because in trading, understanding why the market moves is often just as important as knowing where it’s going.
And hey, if your trades ever go wrong, just blame it on a “Doji moment”—we’ve all had one. 😅
Happy trading!
Disclaimer: Investments in securities market are subject to market risks, read all the related documents carefully before investing.
FAQs
What is the most common candlestick pattern?
That would be the Doji. It shows up a lot on charts across stocks, crypto, forex—you name it. A Doji happens when the opening and closing prices are almost the same, which basically means the market couldn’t make up its mind.
You’ll often spot it during pauses in a trend or before something big is about to happen. But don’t rely on it alone—it needs confirmation from volume or the next candle to really mean something.
Which candlestick pattern is most accurate?
If you’re looking for solid, trustworthy patterns, the Morning Star (for bullish reversals) and Evening Star (for bearish reversals) are top picks. These are three-candle patterns and they usually show up near the end of a trend—right when the tide is turning.
They tend to be more reliable, especially on bigger timeframes like 4-hour or daily charts. Add in volume confirmation, and boom—you’ve got a high-confidence setup.
Do professional traders use candlestick patterns?
Oh, 100%. Pro traders definitely use candlestick patterns—but here’s the key—they don’t rely on them alone. They usually combine them with tools like RSI, MACD, moving averages, and good ol’ support/resistance levels. For them, candlestick patterns are more about timing entries and exits than predicting the market. It’s like using body language to figure out what someone might do next—it’s not everything, but it tells you a lot.
What is the 3 candle rule?
This one’s about patience. The 3 Candle Rule basically says: Wait for three candles to confirm a move before acting.
For example, if you see a bullish signal like a hammer candle:
- First candle: The signal appears.
- Second candle: The market reacts in the expected direction.
- Third candle: It confirms that the trend is likely real.
Only after the third candle do experienced traders consider jumping in. It’s a simple way to avoid fakeouts and emotional trades.
