In recent developments, the United States has increased tariffs on certain Chinese goods, with rates increasing upto to 245%. This move marks a major escalation in the trade tensions between the U.S. and China and has raised concerns in global financial markets.
Following the announcement, stock markets around the world reacted strongly. Investors are now closely watching the Chinese equity market, particularly the Shanghai Stock Exchange, to understand what lies ahead.
At the same time, the Dow Jones Industrial Average and other global indices have shown signs of stress due to fears of a prolonged trade conflict and its impact on global economic growth.
This blog aims to explore how Chinese equities have been affected by this high tariff, what the data shows, and whether there are chances of a recovery. We will also look at recent market trends and historical patterns to assess the possible outcomes for investors.
The 245% Tariff Breakdown: What Happened and Why
The U.S. recently announced a combination of tariffs that could raise the total duty on some Chinese imports to as much as 245%. This is not a single tariff but a result of multiple layers added together. Here’s how it breaks down:
- A 125% retaliatory tariff was introduced in response to China’s actions.
- An additional 20% tariff was imposed on products linked to fentanyl-related chemicals.
- Under Section 301 of U.S. trade law, other goods face tariffs ranging from 7.5% to 100% depending on the product category.
According to official U.S. sources, the decision aims to reduce dependency on Chinese imports, especially in critical sectors like minerals, electronics, and medical ingredients. National security and economic fairness have been cited as the main reasons.
Here’s a breakdown of the Tariff Components:
| Tariff Type | Rate (%) | Description |
| Section 301 Tariff (Base Layer) | 7.5%-100% | Existing U.S. tariffs on Chinese imports under trade enforcement measures. |
| Fentanyl-related Goods Tariff | 20% | Additional duty on materials linked to fentanyl production or trade. |
| Retaliatory Counter-Tariff | 125% | Imposed in response to China’s trade practices and export restrictions. |
| Total Cumulative Tariff (Max) | Up to 245% | Combined effective rate depending on the product and overlapping tariffs. |
China responded strongly. It announced increased duties on some U.S. goods and tightened control over the export of rare earth materials, which are vital for the global tech and defense industries.
This back-and-forth has deepened the trade conflict between the two nations, leading to rising uncertainty in the global investment landscape. Businesses involved in cross-border trade are now reviewing their supply chains, while investors are becoming more cautious.
Immediate Market Reactions: Dow Jones and Shanghai Stock Exchange
The market reacted quickly to the news of these steep tariffs.
In the United States, the Dow Jones Industrial Average experienced a noticeable decline. Concerns about trade restrictions affecting corporate profits, particularly for companies that rely on Chinese supply chains, led to a wave of selling. Analysts also noted that investor sentiment weakened due to the fear of rising inflation and reduced global trade.
On the other side of the world, the Shanghai Stock Exchange also showed signs of stress. Since the start of 2025, the Shanghai Composite Index has fallen by around 2.9%, reflecting investor concerns about export slowdowns and the overall impact on China’s economy.
In both markets, volatility increased. Sectors directly affected by tariffs—such as manufacturing, technology, and chemicals—saw the sharpest movements.
Despite the drop, some experts believe the market is adjusting and could stabilize if there is clarity on future trade negotiations. Others suggest that China’s domestic policy measures may help cushion the impact on local businesses.
History of Chinese Equities Amid Trade Tensions
Trade tensions between China and the United States are not new. Over the last decade, several disputes have led to tariffs and sanctions. These events have had a mixed impact on Chinese equities.
One of the most significant periods was during the U.S.-China trade war from 2018 to 2020. At that time, Chinese stock indices, including the Shanghai Composite and the CSI 300, saw large fluctuations. Initially, markets reacted negatively, but in many cases, the losses were recovered within a few months.
For instance, despite facing multiple tariff rounds in 2018, Chinese markets saw a strong rebound in early 2019 after the Chinese government introduced stimulus packages and eased monetary policies.
Another example is during the COVID-19 pandemic in 2020. Although global markets crashed in March 2020, Chinese equities recovered faster than many expected, supported by strong government action and increased domestic consumption.
These examples suggest that while Chinese markets are sensitive to trade issues, they also have a track record of resilience. The ability to bounce back often depends on how quickly China adjusts its economic policies and how global investors perceive long-term growth.
Assessing China’s Market Resilience
Despite the current tensions, China’s broader economic fundamentals remain relatively stable.
As of the latest data:
- GDP growth for Q1 2025 stood at 4.8%, showing moderate recovery driven by infrastructure and manufacturing.
- Industrial production has remained steady, supported by domestic demand and policy support.
- Retail sales and exports to Southeast Asia and the Middle East have picked up, reducing the impact of lower U.S. demand.
The Chinese government has also introduced several supportive measures, such as:
- Lowering interest rates to increase borrowing and investments.
- Offering tax relief and subsidies to small and medium enterprises (SMEs).
- Promoting domestic innovation and self-reliance, especially in the tech and manufacturing sectors.
Additionally, China is actively working on diversifying its export markets. There is a growing focus on trade partnerships through platforms like the Regional Comprehensive Economic Partnership (RCEP), which includes key Asian economies.
Here’s a comparison of Key Economic Indicators – China vs. U.S. (Q1 2025):
| Indicator | China | United States |
| GDP Growth Rate (Q1 2025) | 4.80% | 2.10% |
| Inflation Rate (Mar 2025) | 0.70% | 3.40% |
| Unemployment Rate | 5.20% | 3.80% |
| Export Growth (YTD) | 0.026 | -1.30% |
| Interest Rate | 3.45% (1-year LPR) | 5.25% (Fed Funds Target Rate) |
| Foreign Exchange Reserves | $3.2 trillion | ~$243 billion |
| Stock Market YTD Change | CSI 300: -2.1% | DJIA: -6.7% |
| Manufacturing PMI (Mar 2025) | 50.2 (expansion) | 49.1 (contraction) |
All these efforts are aimed at reducing dependence on U.S. trade and making the Chinese economy more resilient to external shocks. This could support Chinese equities over the long run.
How are Chinese equities performing?
Let’s now look at some data and market trends to better understand how Chinese equities are performing and what technical indicators are showing.
Shanghai Composite Index
The Shanghai Composite Index, a key benchmark for China’s stock market, has been volatile throughout 2025. After starting the year on a relatively stable note, the index dropped by 2.9% following the tariff announcement.

Source: TradingView
Key technical observations:
- The index is currently trading below its 50-day moving average, indicating short-term weakness.
- Support level is around 2,900, and if it holds, it could signal consolidation.
- A breakout above 3,100 may indicate renewed buying interest from institutional investors.
CSI 300 Index
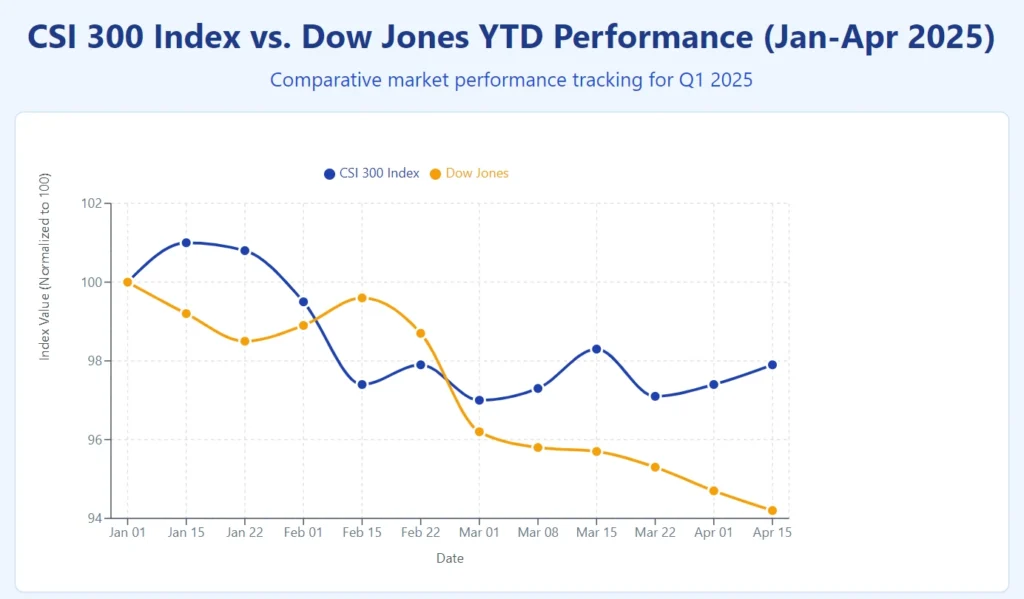
The CSI 300, which tracks the top 300 stocks on the Shanghai and Shenzhen exchanges, shows a similar trend. It fell by about 3.5% year-to-date but remains above its long-term support.
- Momentum indicators (like RSI and MACD) suggest the market is oversold.
- Foreign institutional buying has slowed, but domestic mutual funds have been adding positions.
Dow Jones Comparative Analysis
The Dow Jones Industrial Average showed a sharper decline of over 4% in the week after the tariff news. The reason? Many U.S. companies rely on Chinese imports, especially in electronics and machinery.

Sources: Trading Economics
Comparing both indices:
- The Dow has shown more short-term panic.
- Chinese indices, while down, are showing more gradual corrections, likely due to state support and less direct reliance on U.S. demand.
Conclusion
The recent 245% tariff announcement by the United States has undoubtedly added a new layer of complexity to global trade dynamics. For Chinese equities, this presents both a challenge and an opportunity.
In the short term, the impact has been negative. The Shanghai Stock Exchange and related indices have experienced declines, and investor sentiment remains cautious. However, history has shown that Chinese markets have the capacity to recover from external shocks, especially when supported by strong policy measures and domestic demand.
China’s ongoing efforts to reduce its dependence on U.S. trade, invest in innovation, and strengthen regional partnerships may help its markets stabilize in the months ahead. At the same time, global investors may begin to see value in Chinese stocks if valuations continue to remain low and earnings remain strong.
For investors, the key takeaway is to stay informed and consider a long-term perspective. Diversification, risk management, and close monitoring of global policy developments will be important for anyone looking to invest in or maintain exposure to Chinese equities.
As the situation continues to evolve, one thing is clear—China’s role in the global financial system is far too significant to ignore. Whether this leads to a stunning comeback or a longer period of adjustment will depend on how both nations navigate the months ahead.
Disclaimer: Investments in securities market are subject to market risks, read all the related documents carefully before investing.
FAQs
When did Chinese tariffs go into effect?
China’s retaliatory tariffs in response to the U.S. trade action went into effect in early April 2025. The Chinese government announced the measures shortly after the U.S. imposed its 245% tariff on select imports. These counter-tariffs targeted various U.S. goods, including agricultural products, cars, and critical components, and were part of a broader effort to protect domestic industries and respond to rising trade pressure.
What are the key economic indicators supporting China’s resilience?
China’s GDP grew by 4.8% in Q1 2025, inflation remains low at 0.7%, and exports to alternative markets are growing. These indicators suggest the Chinese economy has buffers to absorb short-term shocks.
Are tariffs hurting China?
Yes, tariffs are hurting China. The increased costs have led to a decline in exports to the U.S., weakened investor sentiment, and added pressure on China’s manufacturing and technology sectors. Certain industries that rely heavily on international trade—such as electronics, machinery, and automotive—have been directly affected.
However, China’s economy is still growing, supported by government stimulus, strong domestic consumption, and expanding trade with other countries. While the impact is significant, it has not led to a full-scale economic slowdown.
Can Chinese equities recover?
Historically, Chinese equities have shown resilience during trade conflicts. With strong government intervention, export diversification, and domestic consumption, a medium- to long-term recovery is possible.

